Title: Beyond UVJ: Color Selection of Galaxies in the JWST Era
Authors: Jacqueline Antwi-Danso, Casey Papovich, Joel Leja, Danilo Marchesini, Z. Cemile Marsan, Nicholas S. Martis, Ivo Labbé, Adam Muzzin, Karl Glazebrook, Caroline M.S. Straatman, Kim-Vy H. Tran
First Author’s Institution: Texas A&M University, College Station, TX, USA
Status: Submitted to ApJ, available on arXiv
Separating the living from the dead
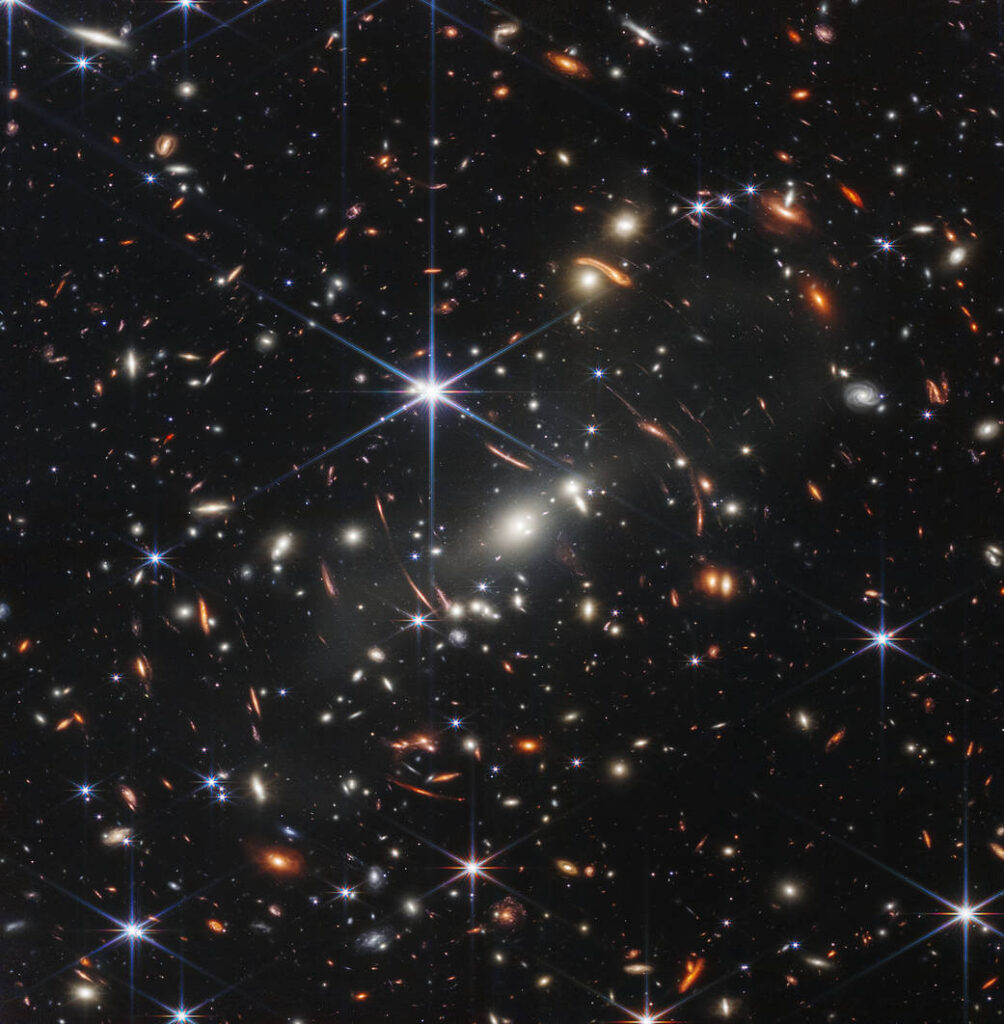
Look at all those galaxies in Figure 1! With JWST, we will be able to observe galaxies both near and far in unprecedented detail. But just what are those galaxies up to? One of the main ways astronomers characterize galaxies is by studying their star formation–are they still actively forming stars, or are they quiescent (dead)? By separating galaxies into these two populations, we can learn how the process of star formation begins and shuts down in galaxies across cosmic time.
Quiescent galaxies are often called “red and dead” because they appear more red in color relative to star-forming galaxies, which have younger and bluer stellar populations. Using this principle, quiescent galaxies are selected through what’s known as a UVJ diagram. In this diagram, the difference in a galaxy’s brightness in an ultraviolet filter (U) and a visible filter (V) is compared to the difference in its brightness in a visible filter (V) and a near-infrared filter (J). Because quiescent galaxies tend to be less bright than star-forming galaxies in ultraviolet and near-infrared bands (they tend to lack the infrared-emitting dust of dusty star-forming galaxies), they will clump together in the upper left part of the UVJ diagram, as seen in Figure 2. With just three photometric data points, large samples of galaxies can be classified as either quiescent or star-forming!
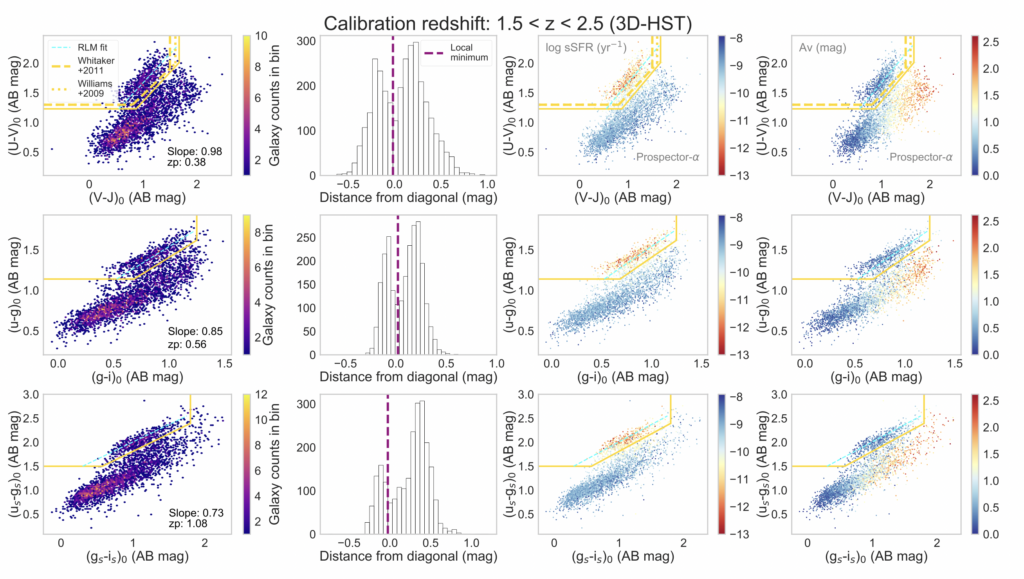
However, there are some problems with selecting quiescent galaxies through this method. For galaxies at higher redshifts (z>3) the near-infrared band J is redshifted beyond the coverage of infrared space telescope instruments like Spitzer/IRAC and JWST/NIRcam. To place these galaxies on the UVJ diagram, astronomers have to extrapolate to determine their J band magnitudes. Additionally, some galaxies have bright emission lines in the visible part of their spectrum, which can falsely boost their U-V color.
A more robust way to determine whether a galaxy is actively forming stars is to look at its spectrum, which we can now do even with high redshift galaxies using JWST! But spectroscopy is more costly than photometry, and we can characterize many more sources by relying on photometric data. To counter these problems, the authors of today’s paper present a new photometric selection method using synthetic filters.
Getting rid of the star-forming imposters with synthetic filters
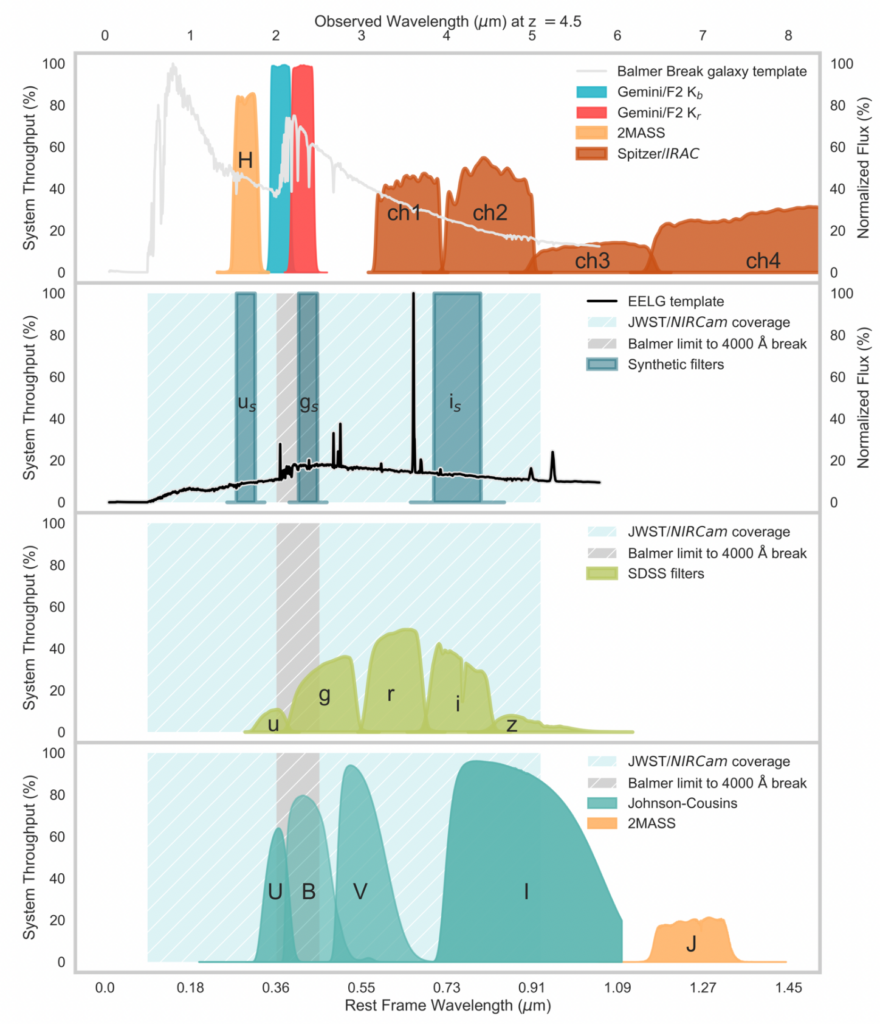
The authors introduce the synthetic filters us, gs and is corresponding with the u, g, and i filters used by SDSS. These top-hat filters are narrow – so they avoid emission lines – but are well separated from one another, which makes this combination of filters capable of distinguishing between dusty star-forming galaxies and quiescent galaxies. Importantly, for higher redshift galaxies the is filter overlaps with Spitzer/IRAC channels and JWST/NIRcam coverage, as seen for a galaxy at z=4.5 in Figure 3.
How do the synthetic filters perform compared with the classic UVJ selection? To investigate this question, the authors look at observational data of galaxies from the 3D-HST and UltraVISTA surveys as well as simulated JWST data of higher redshift galaxies from the JAGUAR catalog. When making selections from this sample of galaxies, two properties of the selected quiescent galaxy population are important: completeness and contamination. Completeness tests what fraction of the total true population of quiescent galaxies is selected, while contamination is related to the number of star-forming imposters that have snuck past the selection process compared to the total number of galaxies selected. Ideally, a selection would maximize completeness and minimize contamination. The authors also examine the ratio of true positives – galaxies which have been selected and are quiescent – to the number of false positives (the star-forming impostors).
At all redshifts, but particularly at high redshifts, the (ugi)s selection outperforms UVJ in terms of contamination. In Figure 4, the completeness, contamination, and ratio of true to false positives is shown as a function of redshift for the sample of high redshift galaxies from the JAGUAR catalog. At z=6, ~60% of galaxies selected by UVJ as quiescent are star-forming – so the selected sample is mostly composed of frauds! By comparison, ~33% of the galaxies picked out by the synthetic filters are star-forming, a significant improvement.
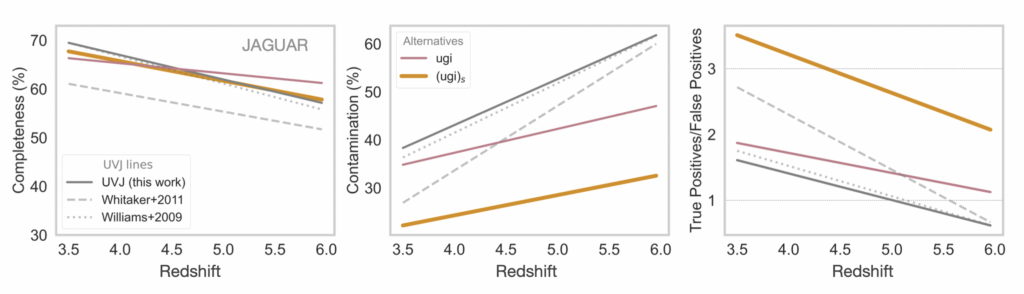
Both selections perform similarly in terms of completeness, with less than 70% of the total quiescent galaxy population selected at z>4 and ~85-90% of the total quiescent galaxy population selected at z=3-3.5. Why do us, gs and is miss more quiescent galaxies at higher redshifts? Galaxies in the early universe wouldn’t have had much time for star formation to shut down compared to more local galaxies, which means they are more likely to be recently quenched. Although these post-starburst galaxies are no longer forming stars, they can appear bluer than a typical quenched galaxy, and thus would be classified as star-forming by falling below the U-V or us-gs cutoff. Alternatively, there may exist a population of dusty quiescent galaxies that is relatively bright in J or is which would be excluded by the V-J or gs-is cut.
In the era of JWST, color selection methods to distinguish between star-forming and quiescent galaxies will likely continue to play an important role in studying galaxy evolution. The (ugi)s selection is promising for weeding out star-forming galaxies at higher redshifts, and the authors note that upcoming spectroscopic data from JWST will further test the efficacy of this method. By being able to select quenched galaxies at higher redshifts (z~6) we may be exploring the first galaxies ever to quench!
Edited by Ishan Mishra
Featured image credit: NGC 1559 by NASA/ESA/Hubble, Abell S0740 by NASA, ESA, and The Hubble Heritage Team (STScI/AURA)