Title: CEERS Epoch 1 NIRCam Imaging: Reduction Methods and Simulations Enabling Early JWST Science Results
Authors: Micaela B. Bagley, Steven L. Finkelstein, Anton M. Koekemoer, et al.
First Author’s Institution: Department of Astronomy, The University of Texas at Austin
Status: submitted to ApJ
Astronomers around the world breathed a sigh of relief when the JWST, a telescope more than two decades in the making, successfully launched and aligned its mirrors this year. However, there are still several challenges and kinks to work out in the imaging processing. In particular, there are many intermediate steps involved in turning JWST’s raw data into the beautiful final images released to the public. This paper, part of the JWST Directors Discretionary Early Release Science (DD-ERS) public programs, is one of the first to try to calibrate and measure some of these issues using real data taken in space.
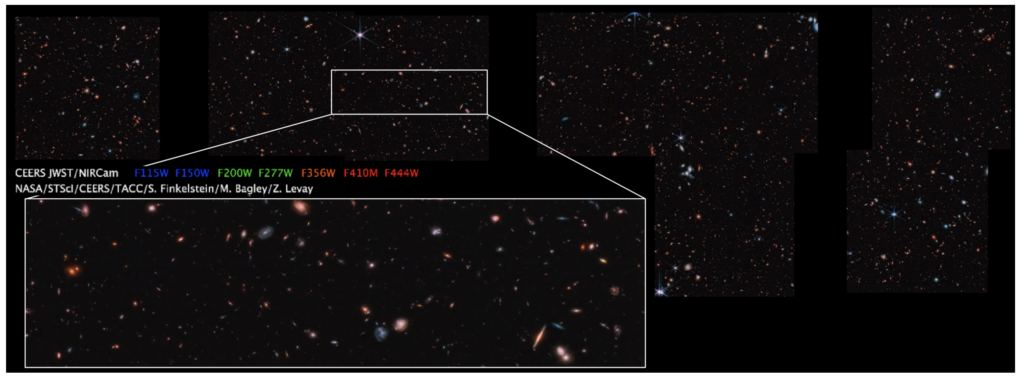
The 13 DD-ERS programs are the first to receive science data from JWST, and in turn, they promise to publicly share all their data products, tools, software, simulations, and documentation to the community to help astronomers learn how to utilize and analyze JWST data. This paper describes in detail one of these programs: the Cosmic Evolution Early Release Science Survey (CEERS), which is obtaining imaging and spectroscopy of the Extended Groth Strip (EGS) Hubble Space Telescope legacy field. The EGS is an image of a small region between the Ursa Major and Boötes constellations, covering about 100 arcmin2. The CEERS team’s main science goal was to test efficient observation strategies for extragalactic surveys with JWST.
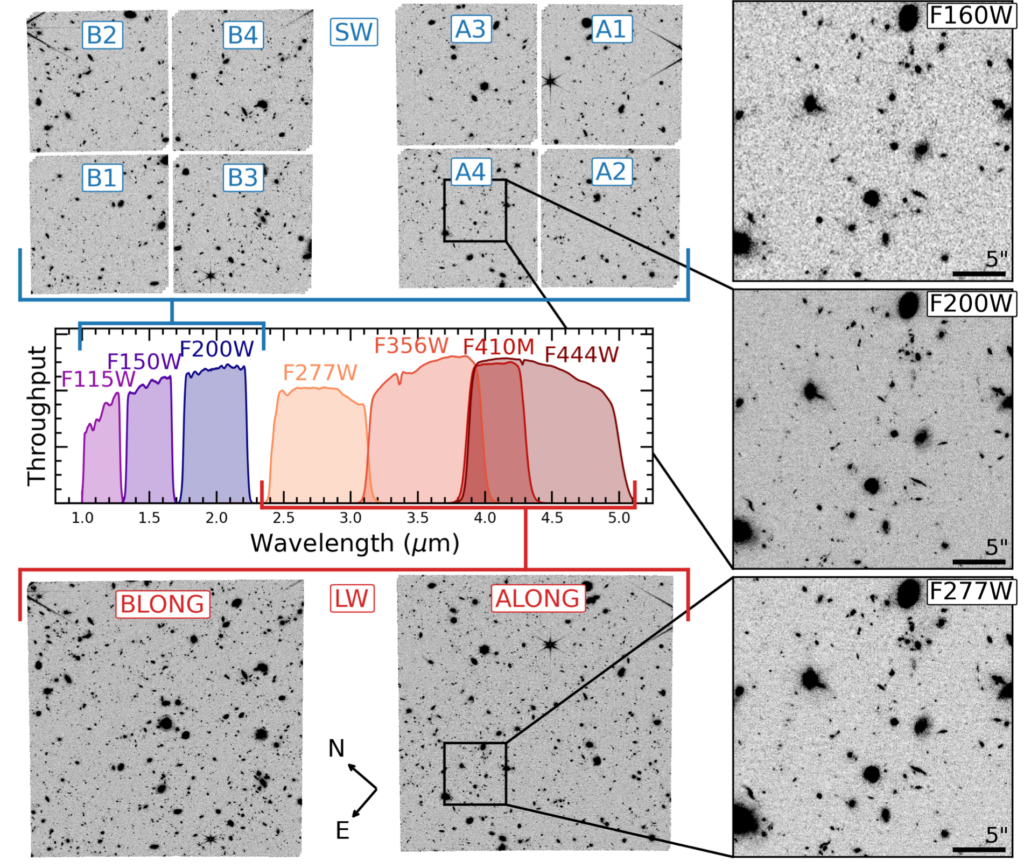
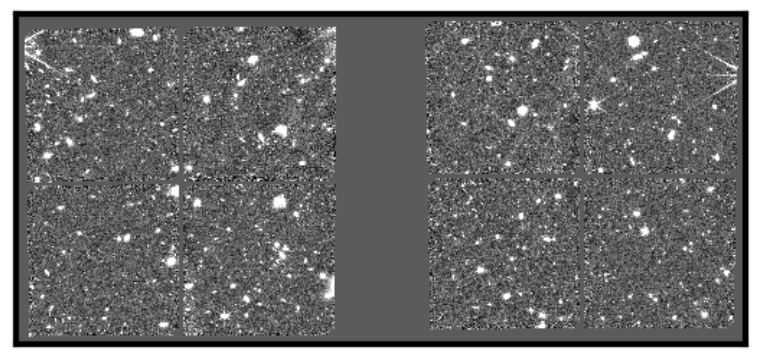
This paper presents the analysis of NIRCam (one of JWST’s cameras) imaging and is one the first official public dataset releases from any DD-ERS programs. NIRCam has two channels that observe in parallel: one short-wavelength and one long-wavelength channel. Each channel has two modules: A and B, each having a field of view of 2.2 arcmin × 2.2 arcmin. Each module has four short wavelength detectors, A1-A4 or B1-B4, tuned for observations in the range 0.6 − 2.3μm, and one long wavelength detector, ALONG or BLONG, tuned for observations in the range 2.4 – 5μm. The long wavelength channel has a resolution of 0.06″/pixel and the short-wavelength channel has a resolution of 0.03″/pixel. Each module A and B have a unique field of view adjacent to each other. So for example, in Figure 2, the same field is simultaneously observed with A1-A4 and B1-B4 (short-wavelength), and ALONG and BLONG (long-wavelength), respectively.
This paper describes the team’s challenges and solutions during the JWST image reduction process. Image reduction in astronomy is processing and converting the raw photons that a detector receives into a flux value from astronomical objects. However, sometimes after processing the images, non-astronomical artifacts can appear in the images. Below is a summary of the three main issues found in the CEERS team imaging.
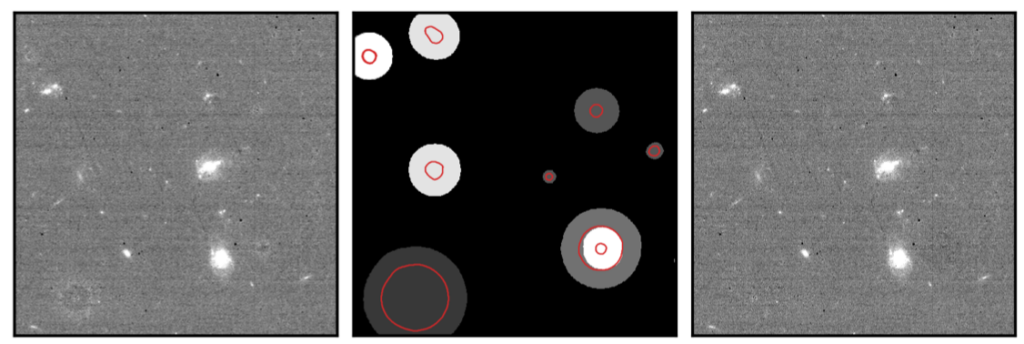
Snowballs are large cosmic ray events that can affect hundreds of pixels and appear as a circular feature on the NIRCam detectors (see Figure 3 for an example of snowball removal). The team saw an average of 25-30 snowballs per detector in their images. To remove the snowballs, the CEERS team identified large contiguous pixels that had jumps in flux and then masked them out of the final image.
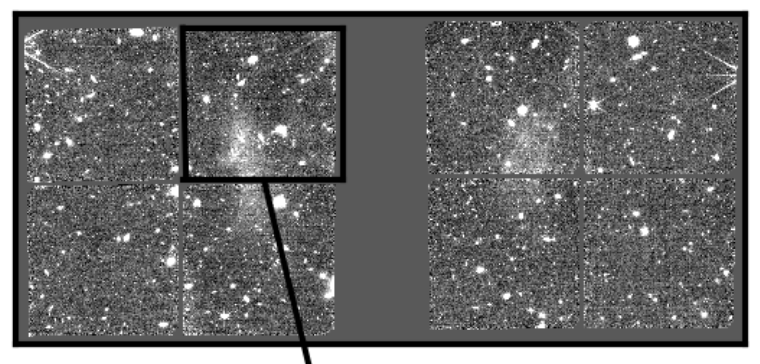
Wisps are created from stray light reflected off the secondary mirror supports. The strength of the wisp features depends on the source of the reflected light. They are visible on detectors A3, A4, B3, and B4 (see Figure 4 for an example). The CEERS team used wisp templates provided by JWST to fit for wisps in their images, and then masked out the wisp features. The wisp templates will continue to improve as more programs obtain NIRCam imaging to characterize the wisps.
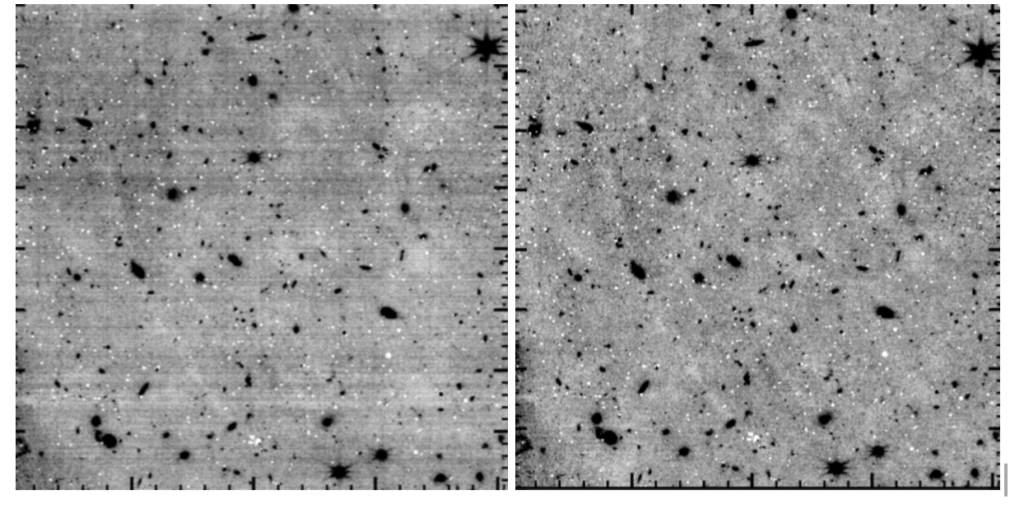
1/f noise, also called pink noise, is correlated noise introduced in the images when the detectors are read out. In many modern CCD detectors, incoming photons create photoelectrons which are trapped in local potential wells in a given pixel. After a specific time, the photoelectrons are counted, or read out, and the pixels are emptied and reset. In contrast to white noise, which has equal intensity per frequency, pink noise dominates at lower frequencies. In the NIRCam images, this noise presents as a horizontal and vertical striping pattern, as shown in Figure 5. To remove the noise, the CEERS team corrected pixel values more than 2-sigma away from the median of a given row or column.
In conclusion, the CEERS team was able to robustly characterize and tackle many of the image-processing problems present in the NIRCam detectors. With more data and time, errors due to the reduction procedures will decrease. The CEERS team put in diligent work to better understand NIRCam, to the benefit of all astronomers using JWST!
Astrobite edited by Katya Gozman
Featured image credit: NASA