Authors: Keiichi Namizaki, Kosuke Namekata, Hiroyuki Maehara, Yuta Notsu, Satoshi Honda, Daisaku Nogami, Kazunari Shibata
First Author’s Institution: Department of Astronomy, Kyoto University, Kitashirakawa-Oiwake-cho, Sakyo-ku, Kyoto 606-8502, Japan
Status: Accepted to The Astrophysical Journal [open access]
Although humans have been monitoring the Sun’s surface activity for millenia, solar flares were only identified in the past ~150 years. These extremely energetic releases of electromagnetic emission occur when the Sun’s magnetic field is reconfigured. While our Sun’s flares can cause particle storms strong enough to knock out power for millions, we regularly see stars experiencing flares as much as 100,000 times larger than the most energetic solar flare ever observed. A large flare from a young, cool, star called YZ CMi was observed simultaneously in H-alpha and optical wavelengths using the Seimei telescope and the Transiting Exoplanet Survey Satellite (TESS) respectively. The authors of this paper tackle the analysis of the anomalously redshifted component of H-alpha observed in this flare.
Origin of H-alpha Asymmetries on the Sun
Hydrogen emission lines like H-alpha are great for studying properties of chromospheres and coronae. The effects of pressure and rotational velocity can produce equal amounts of red and blue-shifted H-alpha emission so that the line is symmetrically broadened. However, net motion of the emitting hydrogen towards or away from us leads to excess blue or red-shifted H-alpha emission– this results in an asymmetry. On the Sun, we see a red asymmetry in H-alpha at the beginning of a flare. This is because huge swaths of hydrogen get accelerated towards where the solar magnetic field connects with the Sun’s surface– called the footpoints– in a process called chromospheric condensation. The opposite reaction is called chromospheric evaporation, and produces a blueshift. Chromospheric condensation deposits a bunch of high energy particles that heat the magnetic field’s footpoints, resulting in additional blackbody emissions that we call the white light (WL) component of a flare. As the flare decays following this initial part of the flare– known as the impulsive phase– there remain some red asymmetries as magnetic field loops continue to gradually funnel the hydrogen downwards.
Observations of YZ CMi
YZ CMi is an M-dwarf, meaning it’s a very cool and very small star. This makes increases in temperature, like those that cause the WL flare components, much easier to see than they are on the hotter and larger Sun. YZ CMi is also known to frequently flare. These properties make it a prime candidate to look for flares with multiple instruments for simultaneous, multi-wavelength studies of stellar flares. The authors observed YZ CMi with a spectrograph on the 3.8m, Seimei telescope at the Okoyama Observatory in Japan during a period that it also was present in a TESS field. During this time of overlap, the two instruments witnessed a flare with ~1034 erg of bolometric energy (100 times what we’ve ever observed from the Sun!), for which 1032 erg was contained in the H-alpha component (see figure 1).
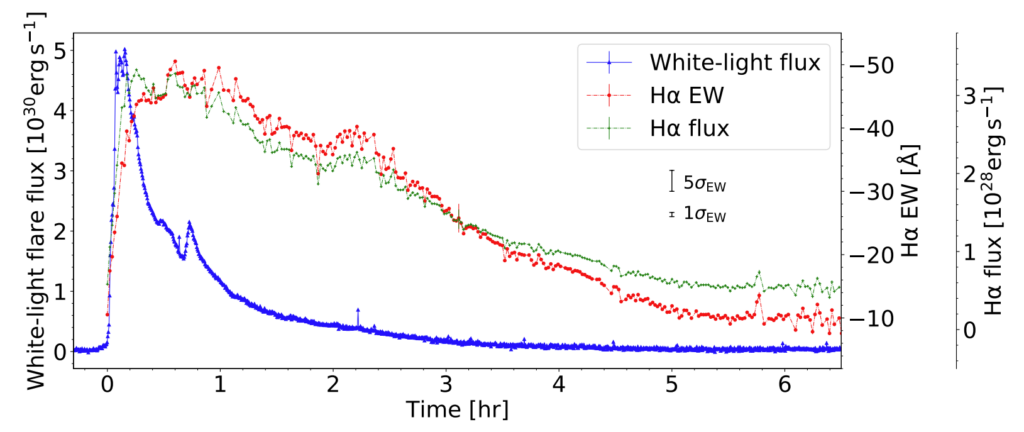
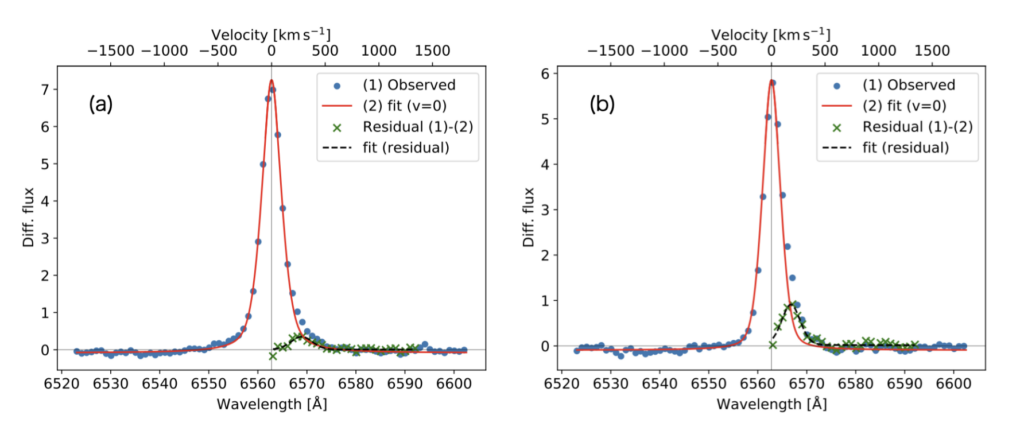
The authors analyzed the H-alpha flux and equivalent width (EW) of this event to be able to look more in depth at the different components of the flare. To do this, the authors fit a line profile to the H-alpha spectrum. Following this, they subtracted the model from the data to extract a red asymmetry component from the spectrum, as shown in figure 2. This data processing means that, all together, these observations reveal three components of the flare: the WL emission, the central H-alpha emission fit by the model, and the red, asymmetric H-alpha emission.
Results
Between the three components, there are three main features that the authors address in this paper. Firstly, the H-alpha central linewidth– defined as twice the width of just the blue side of the line so as to exclude the red asymmetry– shows a similar time-evolution as the WL flux. Secondly, the redshift velocity of the H-alpha also shows a similar time-evolution as the WL flux. These two features together suggest that the H-alpha broadening and redshifting mechanism is linked to the WL emission mechanism. The authors suggest that the amount of broadening observed can only be explained by a unique pressure environment. One possibility is electrons heating material deep in the chromosphere, just as in chromospheric condensation on the Sun.
The third feature they address is the ratio of the red asymmetry’s EW to the central component’s EW. The ratio is small in the initial phase, and reaches 20% while the flare emission decays. This could imply that we’re seeing an evolution in the H-alpha emission origin: at the beginning of the flare, the relative strength of the red asymmetry may appear weaker if there’s also a blue asymmetry due to chromospheric evaporation, making the ratio appear smaller. Later in the flare we stop seeing the effects of evaporation, and strictly see the effects of the remaining magnetic field loops funneling hydrogen to YZ CMi’s surface, making the asymmetry seem stronger and, thus, the ratio larger. This is consistent with what we see on the Sun!
Simultaneous photometric and spectroscopic observations provide an opportunity to study transient events like flares incredibly robustly– there are still more features in the data presented in this work that the authors intend to address. These observations are a great step towards understanding how stellar flares compare to solar flares and exemplifies the importance of simultaneous, multi-wavelength observations.
Astrobite edited by Junellie Gonzalez Quiles and Sasha Warren
Featured image credit: Adapted from Torsten Bronger’s Celestial Chart Generation