Title: The Loneliest Galaxies in the Universe: A GAMA and GalaxyZoo Study on Void Galaxy Morphology
Authors: Lori E. Porter, Benne W. Holwerda, Sandor Kruk, Maritza Lara-López, Kevin Pimbblet, Christopher Henry, Sarah Casura and Lee Kelvin
First Author’s Institution: University of Louisville, Kentucky, USA
Status: Accepted for publication in the Monthly Notices of the Royal Astronomical Society (MNRAS)
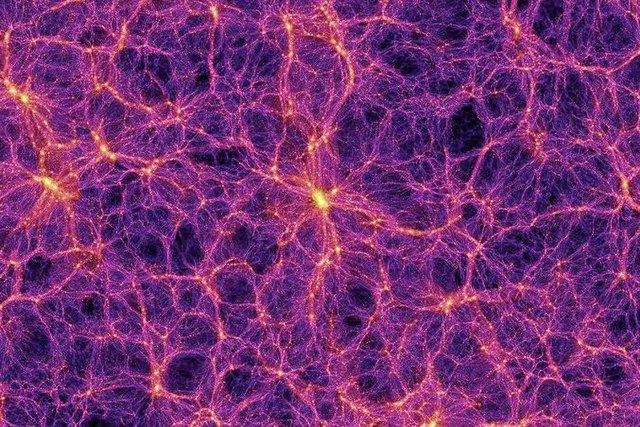
Astronomers have long attempted to understand precisely how the environment in which galaxies evolve affects their fate. But what do we mean by environment? Well, in cosmology, we are often referring to the cosmic web. It’s a complex network of filaments of ordinary and dark matter resembling a spider’s haunt, which are separated by extremely empty regions of space, known as voids.
While galaxy clusters tend to accumulate along the dense filaments and tendrils of the cosmic web due to the never-ending tug of gravity, it is still possible for some lonely galaxies to evolve in the void. These galaxies are some of the most isolated objects in the universe, and thus, it’s very possible that their evolution differed from their more social counterparts, imbuing them with distinct properties and morphologies.
The authors of today’s bite attempted to see if this is indeed the case by studying the properties of void galaxies and their twins, or equivalent galaxies in the dense filaments and tendrils of the cosmic web that the authors refer to as field galaxies. By comparing the void galaxies to their twins in the field, the authors were able to control for other galaxy properties such as redshift (a proxy for distance), star formation rate and stellar mass. This enabled them to focus on whether environment is an important factor in galactic evolution.
Selecting Samples within Samples
Galaxies in the study were identified as part of the GAMA (Galaxy and Mass Assembly) Survey, with the void and field galaxy samples being selected from the GAMA Large Scale Structure Catalogue (GLSSC). To understand the morphological properties of their samples, the authors relied on data from the GAMA-KiDS Galaxy Zoo survey, an exciting example of citizen science in which members of the public are invited to help classify galaxies based on their physical features. If you’re interested in taking part, you can get started and help to classify galaxies here!
In addition, since galaxy morphological features are known to vary with redshift, the authors further divided their void and field galaxy samples into local and distant groups, with redshifts between 0 and 0.075, and 0.075 and 0.15, respectively. Moreover, to increase their sample size, the authors considered two samples of twins, one with stricter conditions to be counted as a twin and another with looser conditions. By using the sample with looser conditions, the authors were able to increase their sample size of twins, allowing stronger conclusions to be drawn in that case. However, the downside is that these twins are slightly less comparable on the whole to the void galaxies.
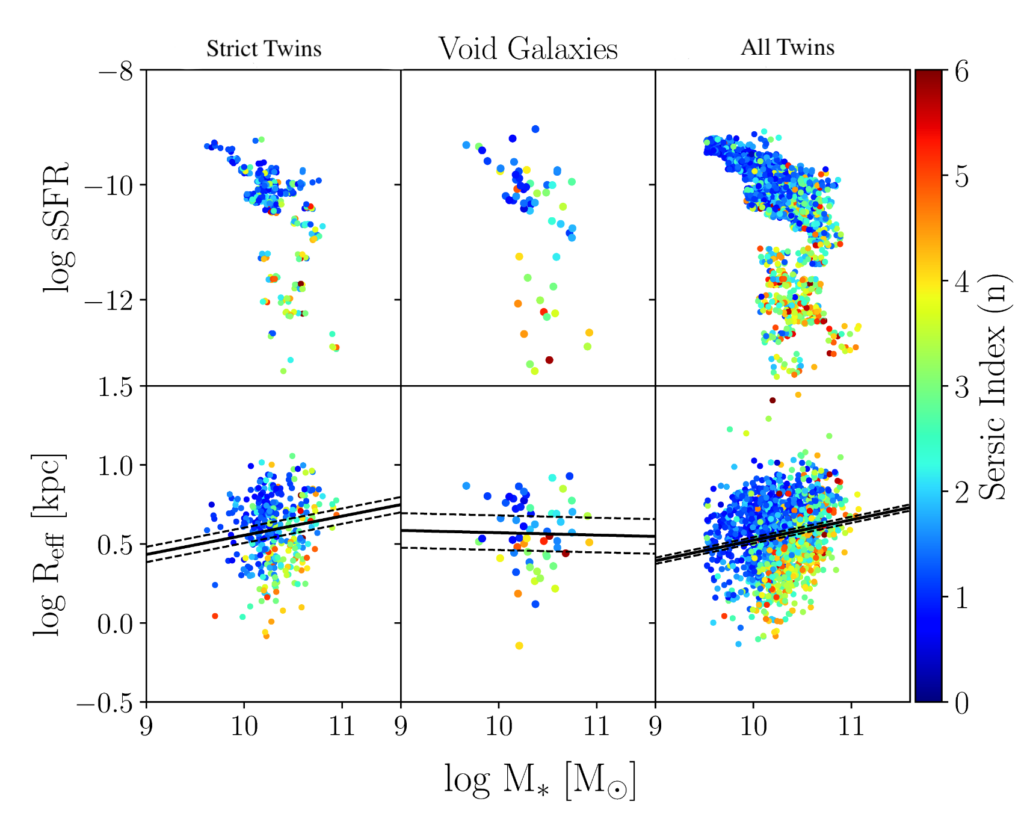
Armed with their samples, the authors then set about to see how certain properties varied amongst the populations. Figure 2 shows plots of the star formation rate (SFR) and effective radius (Reff) as a function of stellar mass (M*) for the void galaxies compared to their twins for the local dataset.
The data points are coloured according to their Sersic Index, which describes how the intensity of light from a galaxy varies radially. A Sersic index greater than 2 indicates that the light is centrally peaked and falls off quickly, as one might expect from an elliptical galaxy. On the other hand, Sersic indices of less than 2 are typical of disk-type galaxies, such as spiral galaxies, as they indicate that the intensity is more constant throughout the galaxy. Looking at figure 2, it is clear that the two morphological groups cluster together, with disk-type galaxies in blue and elliptical galaxies in green and yellow.
Also of note in figure 2 is the size-mass relation that the authors fitted to the data in the bottom three panels, shown as the black lines with the error indicated in dashes. The size-mass relation is often used to understand how evolved a galaxy is, since larger galaxies with greater radii tend to have more mass, likely indicating past mergers with other galaxies and hence a longer lifetime. The bottom middle panel showing the void galaxy data appears to have a different trend compared to the two twins data sets on either side, possibly indicating a different evolutionary history. However, the authors caution any strong conclusions given the small sample size.
Next, the authors turn their attention to the morphological features studied by the citizen scientists of the Galaxy Zoo survey. As part of the survey, one question participants were asked was ‘How prominent is the central bulge, compared with the rest of the galaxy?’
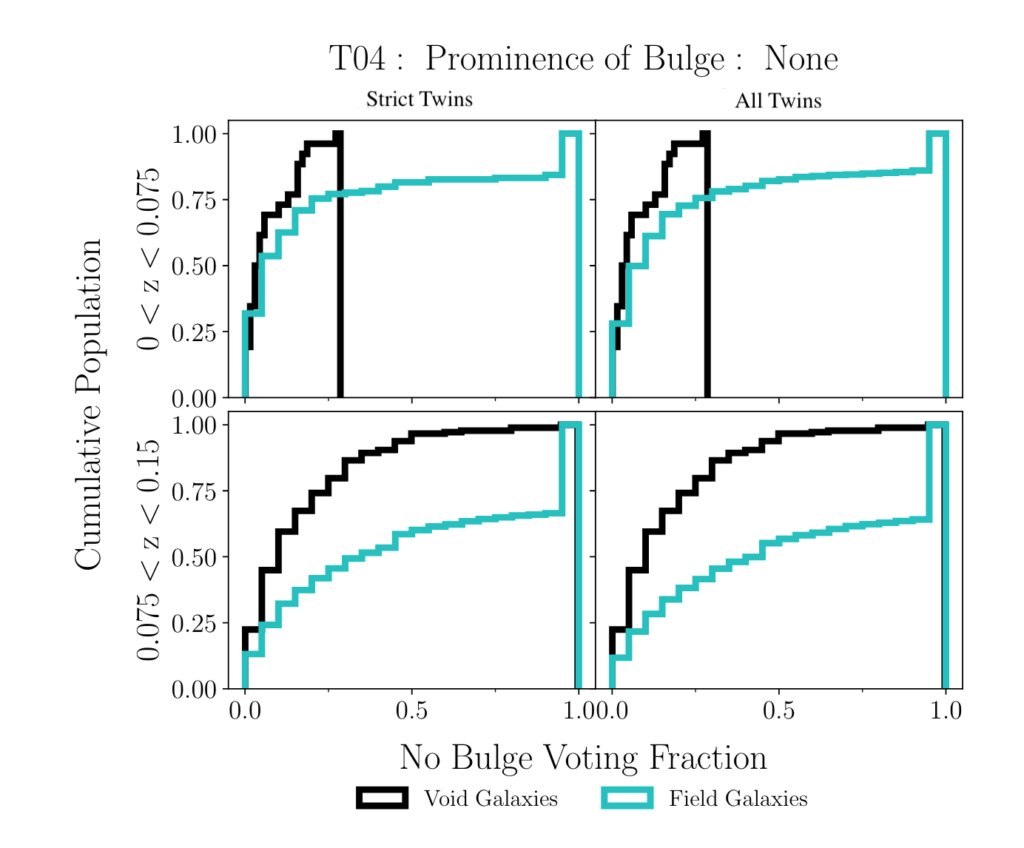
Figure 3 shows cumulative histograms of the voting fractions for the local and distant samples, and compares the void galaxies in black to the field galaxies in blue. The voting fraction (on the x-axis) indicates what percentage of the population agreed that there was no bulge in the image they were shown. For example, a voting fraction of 0.6 indicates that 60% of respondents agreed there was no bulge present in the image they were shown. The y-axis then shows the cumulative distribution of voting fractions for the populations, so a curve that is initially steep and then plateaus out indicates that most galaxies in the sample had low voting fractions and hence had a bulge. The left panels use the field galaxies with the strictest conditions to be considered a twin, while the data from all twins were used in the right panels.
For the local dataset (top row of figure 3), both the void and field samples have 75% of galaxies within a voting fraction of 0.25, meaning participants strongly disagree with there being no bulge in these populations. More simply, these populations on the whole showed evidence of a bulge. In the distant sample below, the same holds for the void galaxies, however, the field galaxies show more diversity and do not always have a bulge present as there is a flatter, more even distribution of voting fractions.
Given the small sample sizes of the study, the authors ultimately conclude that void galaxies are largely similar to their filament and tendril twins, particularly in the local universe regime. That being said, there are hints that isolated galaxies may evolve differently to their counterparts in denser regions of the universe. With a larger sample size, things will become clearer. However, at least for now, the void galaxies appear to be doing just fine, even if one is the loneliest number.
Featured image credit: Volker Springel / Max Planck Institute For Astrophysics via Wikimedia Commons.
Astrobite edited by Isabella Trierweiler