Title: Long-term follow-up observations of extreme coronal line emitting galaxies
Authors: Peter Clark, Or Graur, Joseph Callow, Jessica Aguilar, Steven Ahlen, Joseph P. Anderson, Edo Berger, et al.
First Author’s Institution: Institute of Cosmology and Gravitation, University of Portsmouth, Portsmouth, PO1 3FX, UK
Status: Submitted to MNRAS [open access]
The universe is a violent place. Right now, at this very instance, a star that has wandered too close to its central black hole is probably getting shredded apart in a spectacular display of light and energy. These events are called Tidal Disruption Events or TDEs. You can determine if a TDE has occurred by looking for bright luminous spots that appear in images taken at different times or by scanning through X-Ray data to see if there has been a sudden increase in X-ray activity.
These events can also be identified by looking at how their light is distributed, also known as spectra. The spectra of certain galaxies show emission lines that can only be caused by a strong, energetic process, such as a star falling into a black hole! These lines are called coronal lines because they were first discovered in the solar corona and are caused by metals such as iron. An energetic activity would knock out nearly seven to nine electrons from these iron atoms, so they are typically found in a highly ionized state. The presence of such extreme lines has caused the galaxy that hosted such an event to be known as ‘Extreme Coronal Line Emitters’ or ECLE.
Because we live in a violent and energetic universe, TDEs aren’t the only events that can lead to the formation of these coronal lines. Material falling into active black holes (Active Galactic Nuclei or AGNs) or stars that explode at the end of their lifetime could just as easily produce coronal lines in a spectrum. To better understand what event caused the appearance of coronal lines, one can study such objects periodically over long intervals to see if the coronal lines have persisted or disappeared. If the coronal lines were caused by a quick, short burst event like a supernova or a one-time close encounter of a star with the central black hole, the coronal lines would likely fade over time. If they are caused by the excited environment around the supermassive black hole, they are likely to be present in spectra taken a long time apart.
The authors of today’s paper take a sample of ECLE and examine their spectra obtained at different times. They see if the coronal lines have persisted or vanished and try to determine what could have caused the coronal lines to appear in the spectrum initially.
Are you there, coronal lines?
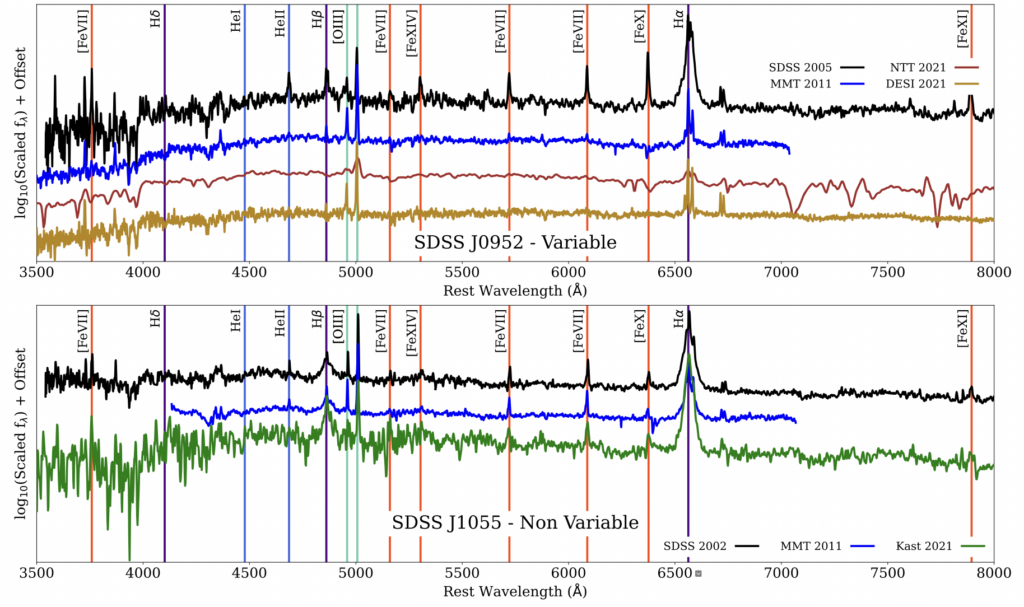
In this work, the authors collect data for 7 ECLE (classified based on the coronal lines present in the earliest spectra) obtained at different times over nearly 15 years. The authors compare the earliest spectra with follow-up spectra obtained in the years since to see if there is any variation. As shown in Figure 1, 5 of the 7 ECLEs with coronal lines in the early spectrum show a decline in strength in the spectrum obtained later, indicating that the lines have faded. In the remaining 2, the coronal lines could still be detected in a later spectrum.
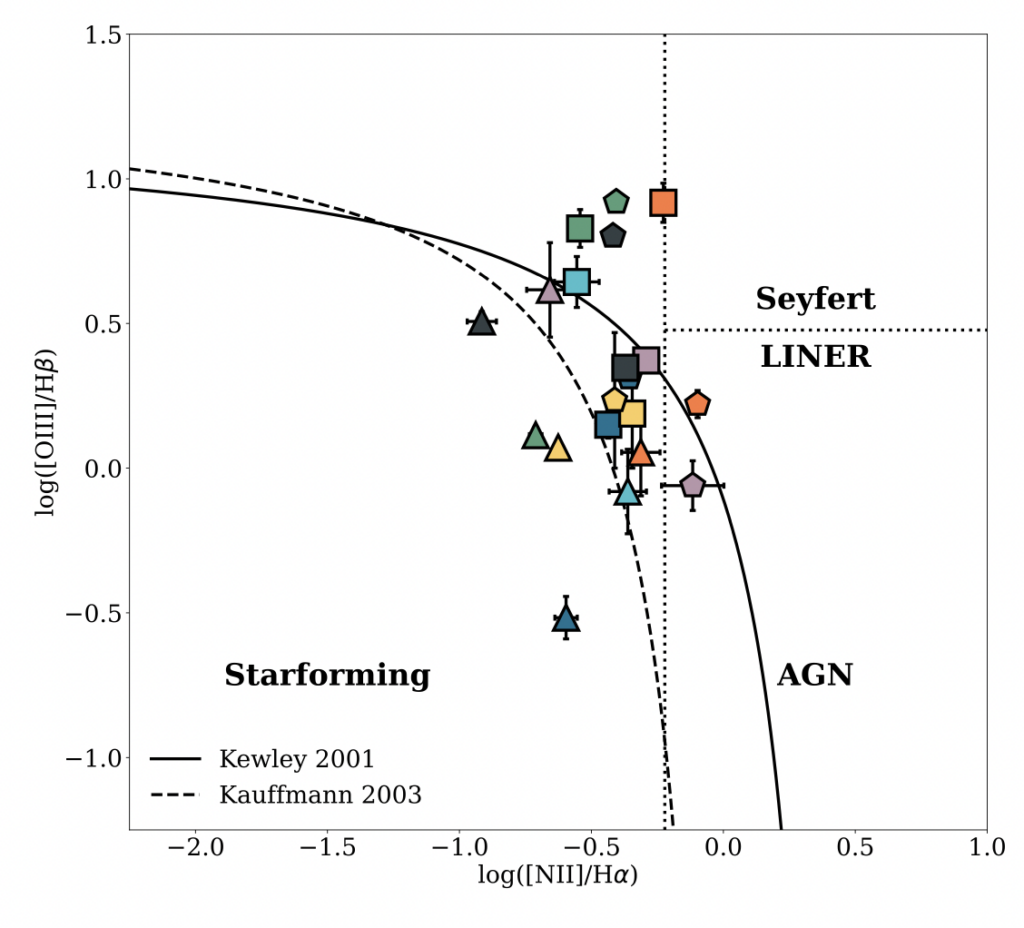
The disappearance of the coronal lines hints that they could have likely been caused by a one-off highly energetic activity. To better understand the effect this activity could have had on its surrounding environment (i.e., the galaxy that hosted the event), the authors look to the Baldwin, Phillips & Terlevich (BPT) diagram, which can be used to classify if galaxies are star-forming or if they have a black hole based on the ratios of emission lines. They found that initial classification on the BPT diagram showed that all 7 ECLE targets are star-forming and have no strong signatures of a black hole. However, with time, the targets whose coronal lines have faded show a significant shift towards AGN, as seen in Figure 2. In contrast, the targets whose coronal lines have not varied remain in the star-forming or composite region of the BPT diagram.
Looking in the MIRror
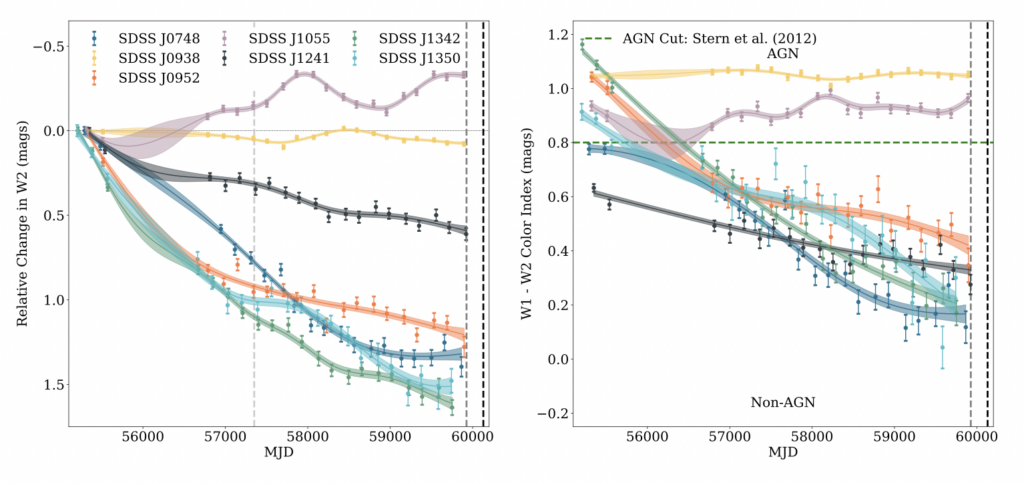
Infrared fluxes can also be used to understand the effect of the event. The authors tracked the evolution of the ECLEs in the mid-infrared (MIR) to see if there was any significant change with time. They observed that, with time, all the targets whose coronal lines had dimmed showed a decrease in their infrared flux, while the two targets whose coronal lines persisted did not show any significant change. They also found that the color of the galaxies, which can be obtained from the difference between the fluxes in two different bands, seemed to change for the targets with faded coronal lines, pushing them more into the expected colors for non-AGNs (see Figure 3). This is in stark contrast to the results obtained from optical measurements of the BPT diagram, indicating that there is more to these objects than what meets the eye!
That’s some mysterious cosmic fireworks!
Through this work, the authors highlight the importance of studying coronal lines across different periods to truly understand the nature of the activity that caused the lines. Coronal lines that were found in the initial spectra of some galaxies have disappeared from spectra taken at a later time, and this can be used to determine if they were caused by a TDE. The contrasting differences between the galaxies whose coronal lines have faded with time and those whose coronal lines have persisted indicate that there is still plenty to be understood about these cosmic fireworks and how they affect their surrounding environments!
Astrobite edited by Maryum Sayeed
Featured image credit: ESO/M. Kornmesser