Title: FRB 20121102A: images of the bursts and the varying radio counterpart
Authors: L. Rhodes, M. Caleb, B. W. Stappers, A. Andersson, M. C. Bezuidenhout, L. N. Driessen, I. Heywood
First Author’s Institution: University of Oxford, United Kingdom
Status: Accepted in MNRAS [closed access]
Fast radio bursts (FRBs) are one of the newer members of the astronomical transient family. Like the name suggests, FRBs are short flashes of radio light that last a few to several hundreds of milliseconds. From observations, they’re known to originate outside the Milky Way, with highly magnetised neutron stars known as magnetars proposed as a possible source. Only stepping on the scene in 2007, they remain mysterious, and astronomers are keen to better understand their origins.
Enter FRB 20121102A, the first FRB to be localised, or to have its exact position identified. Its home was found to be a dwarf galaxy at a redshift of 0.19, and sitting at its origin is what the authors of today’s paper refer to as a persistent radio source, or PRS.
Evidently, some FRBs, including FRB20121102A, originate from sources that emit radio light as they go about their ordinary, day-to-day lives, and every now and again they release a bright burst of emission known as an FRB. With this as their motivation, the authors of today’s paper performed an analysis of the PRS behind FRB20121102A, hoping to better understand the true nature of the source.
Meerkat on the Lookout
To get a good view of the source, the authors studied observations of the PRS using the MeerKAT Telescope in South Africa. Consisting of 64 dishes, each 13.5 m in diameter, MeerKAT is one of the most sensitive multi-dish telescopes on the planet. It observed the PRS at a frequency of 1.28 GHz on five occasions between 2019 and 2022, and the results from these observations plus those from previous studies using the Very Large Array (VLA) and other Very Long Baseline Interferometry (VLBI) facilities can be seen in Figure 1.
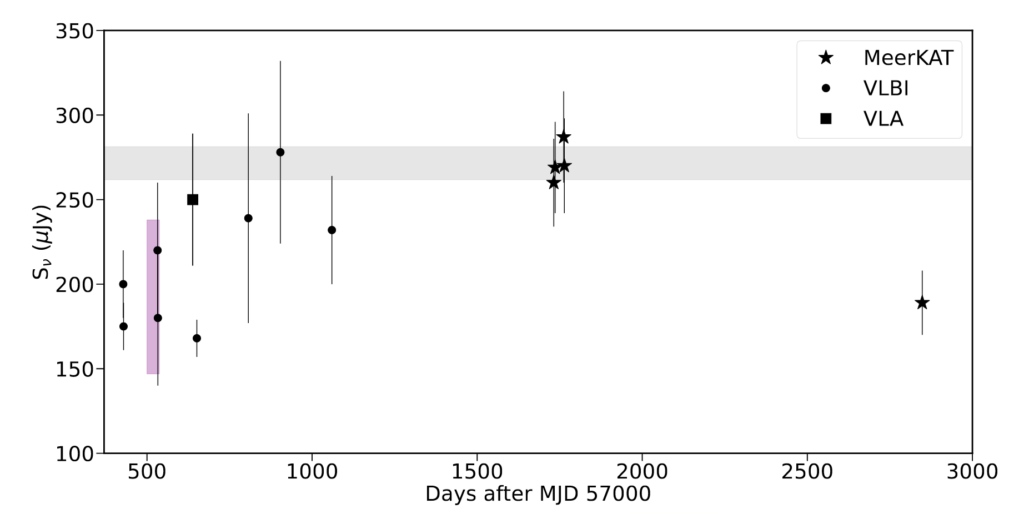
What’s most interesting in Figure 1 is that the PRS’s flux density varies with time, increasing from the value seen in the earliest observations using the VLA to that found using the first four MeerKAT observations. Making things even more complicated is the fact that in the most recent MeerKAT observation, the flux density decreased by roughly one third from the peak value.
Such behaviour is somewhat unexpected, and gives rise to two questions. Firstly, is the behaviour real, or can it be attributed to a calibration error with the observational setup? And secondly, if it is real, what kind of source could give rise to the observed light curve?
The authors started by trying to answer the first question. To do this, they calculated two parameters for each of the sources in the entire field of view of the MeerKAT observations. The two parameters they chose were η and V, which are the statistical significance and the amplitude of the variability, respectively, and are both calculated from the flux density of the sources. The authors were hoping to see if other sources in the field of view showed strange behaviour that might be caused by a calibration error. If no bizarre trends in the distribution of η and V are seen across the field, it’s likely that the decrease in flux seen in the last observation of the PRS is real.
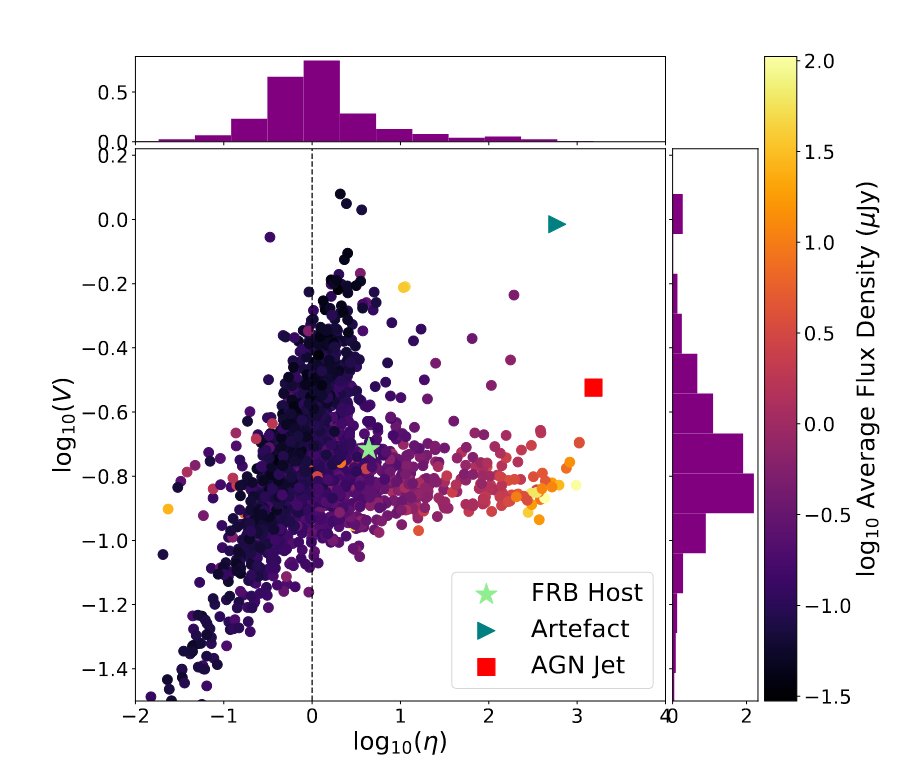
Figure 2 shows a plot of V against η for the PRS as well as other sources in the field of view during the MeerKAT observations. What’s important in this plot is the distributions of V and η across the entire sample, which are shown as the histograms on the x- and y-axes. For both parameters, the distributions are roughly Gaussian. If a calibration error had occurred, the distributions would show strong deviations from the expected Gaussian shape. Since no such behaviour is seen in the data, the authors concluded that the sharp decrease in the flux density from the PRS was real and was not the result of a calibration error with the telescope itself.
With this result in mind, the authors attempted to understand what type of source could give rise to the observed variation in the flux density of the PRS. Using their MeerKAT data, they first calculated the luminosity, or brightness, of the source, finding an average value of 2.6 x 10^29 erg/s/Hz across the 5 observations. This is a rather high value, however it is consistent with that expected from the nebula carved out by the winds of a central magnetar, known as a pulsar wind nebula. In addition, the authors determined the spectral index of the emission from the PRS, which describes how the emission varies with frequency. They obtained a value of -0.4, which is also consistent with the pulsar wind nebula hypothesis.
Finally, the authors compared light curve models of pulsar wind nebulae to that of the PRS. While the observed flux variation is not typical for these objects, it’s possible that a phenomenon known as scintillation might offer the solution. Scintillation would cause the PRS’s brightness to vary with time due to the movement of the gaseous material that the PRS’s light passes through, in a similar way to how stars appear to twinkle in the night sky due to the movement of the atmosphere. Scintillation is expected to vary the PRS’s light on a roughly half-year timescale, so unfortunately the years-long gap between MeerKAT observations makes it difficult to confirm or rule out this scenario without more frequent observations in the future.
Based on the available evidence, the authors finished by suggesting a highly-magnetised pulsar wind nebula as a possible source of FRB20121102A. However, more regular observations in the future are required to pinpoint the exact nature of the source and to better understand whether other FRBs are similar or not. So while FRB20121102A does appear to be fast and radio luminous, there’s still plenty of mystery to go around
Astrobite edited by Delaney Dunne
Featured image credit: ESO/M. Kornmesser via Wikimedia Commons