Title: The preeminence of ethnic diversity in scientific collaboration
Authors: Bedoor K. AlShebli, Talal Rahwan, and Wei Lee Woon
First Author’s Institution: Department of Computer Science, Masdar Institute, Khalifa University of Science and Technology, Abu Dhabi, UAE
Status: Published in Nature Communications [open access]
The importance of diversity, equity, and inclusion initiatives in academia (or really, any field) is clear. From a moral and philosophical perspective, the value of creating a diverse workforce and supporting an equality of opportunities for everyone—regardless of background—is indisputable. Indeed, there is evidence to support this—teams composed of people hailing from a variety of backgrounds, bringing together a diversity of perspectives, are generally more successful at completing complex tasks than homogeneous groups. While today’s bite summarizes a paper that is about attempting to identify correlations between academic impact and diversity, it is important to keep in mind that diversity is necessary and valuable regardless of any correlations with “success”.
Motivated by this, today’s authors seek to quantify the “importance” of diversity in scientific publishing. They contend that academic publishing provides a natural testbed for such analysis, with group membership easily inferred from author lists and citation counts taken as a metric for scientific impact. Using a dataset of roughly 1 million scientific papers across a variety of subfields, the authors analyzed the correlations (or lack thereof) between level of diversity and scientific impact.
Quantifying diversity
To establish a foundation on which they could quantify the impact of diversity in academic work, today’s authors first quantify the presence of homophily—the tendency for people to collaborate with those similar to themselves—in academia. In particular, they focus their analysis on five key attributes: ethnicity, discipline, gender, affiliation, and academic age. Studying this breadth of attributes is intended to reflect the range of factors that can play into teamwork and collaboration. For example, geographic affiliation can be a proxy for understanding the culture of collaboration and the medium by which one’s work is carried out (e.g., a geographically diverse group may communicate primarily via Zoom, rather than in person), while ethnicity might influence a scientist’s social identities and biases.
Here, however, it is important to note that there are challenges with carrying out an analysis like this. In order to automatically classify scientists by the more nebulous and generally not-publicly-shared characteristics, such as gender and ethnicity, today’s authors turned to their names. By passing scientists’ names through publicly-available codes, they assigned ethnicities and genders to their sample of scientists. This means that inasmuch as surnames and first names can be an accurate proxy for ethnicity and gender, respectively, the classifications are robust, but will fall short with respect to multiracial or non-binary individuals, for example. These cases aside, robust classification of gender and ethnicity purely based on name is still very challenging—their gender classifier returned ‘unknown’ for nearly 50% of their sample and the ethnicity classifier has a posted accuracy of 80%. Nevertheless, with these caveats in mind, we can proceed to discuss their analysis and results.
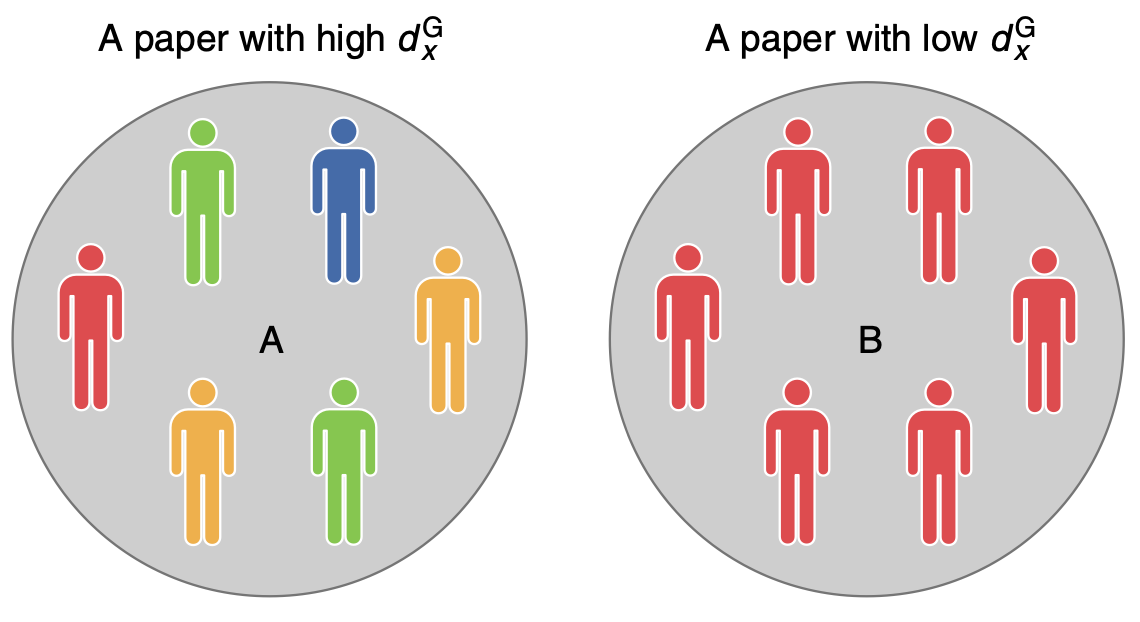
To quantify the degree of homophily in the research teams, today’s authors make use of the Gini impurity index, a metric often used in machine learning algorithms for classification. The Gini index is the probability of incorrectly classifying a randomly selected element from a group if you randomly assign it a classification based on the distribution of classes in the group. For example, if a group is homogeneous—e.g., all the authors of a paper are male—then the group’s gender Gini index, dgen, will be 0 (i.e., a random class assignment will always be correct), and similarly, if the group is composed of all different members, then the Gini index will approach 1—see Figure 1 for a schematic example.
To explore the extent to which homophily exists, today’s authors compare the distribution of Gini indices to a set of randomized baseline models, where they shuffled a particular attribute while holding all others fixed—in effect, for ethnicity, they simulated a universe in which ethnicities are treated as randomly represented in the co-authors of the selected papers, while retaining other criteria.” By comparing the distribution of real Gini indices to the output of this randomized model over time, they are able to directly investigate how the level of diversity compares to what one would expect purely by random chance in group creation, as is shown in Figure 2.
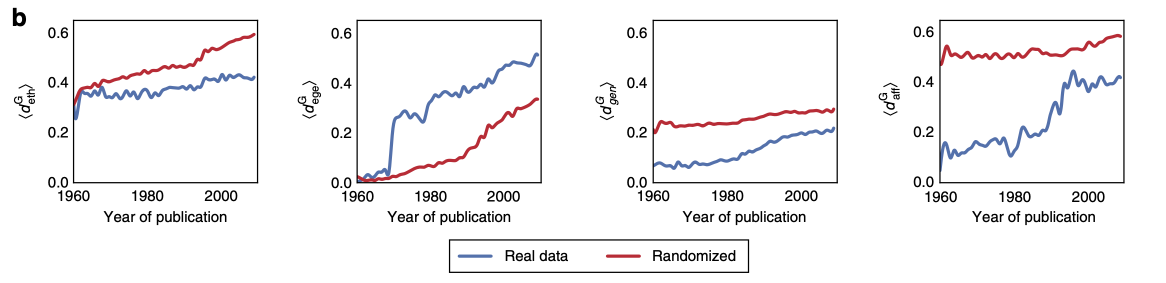
From this, they demonstrate that, for ethnicity, gender, and affiliation, the average Gini index is consistently lower than the randomized data, meaning that scientists tend to form groups that are ethnically, gender-, and affiliation-homogeneous. The trends of gender and affiliation diversity appear to be converging as time goes on, meaning that groups are getting progressively more diverse, while ethnic diversity within groups seems to be lagging behind the diversification of academia.
The effects of diversity on scientific impact
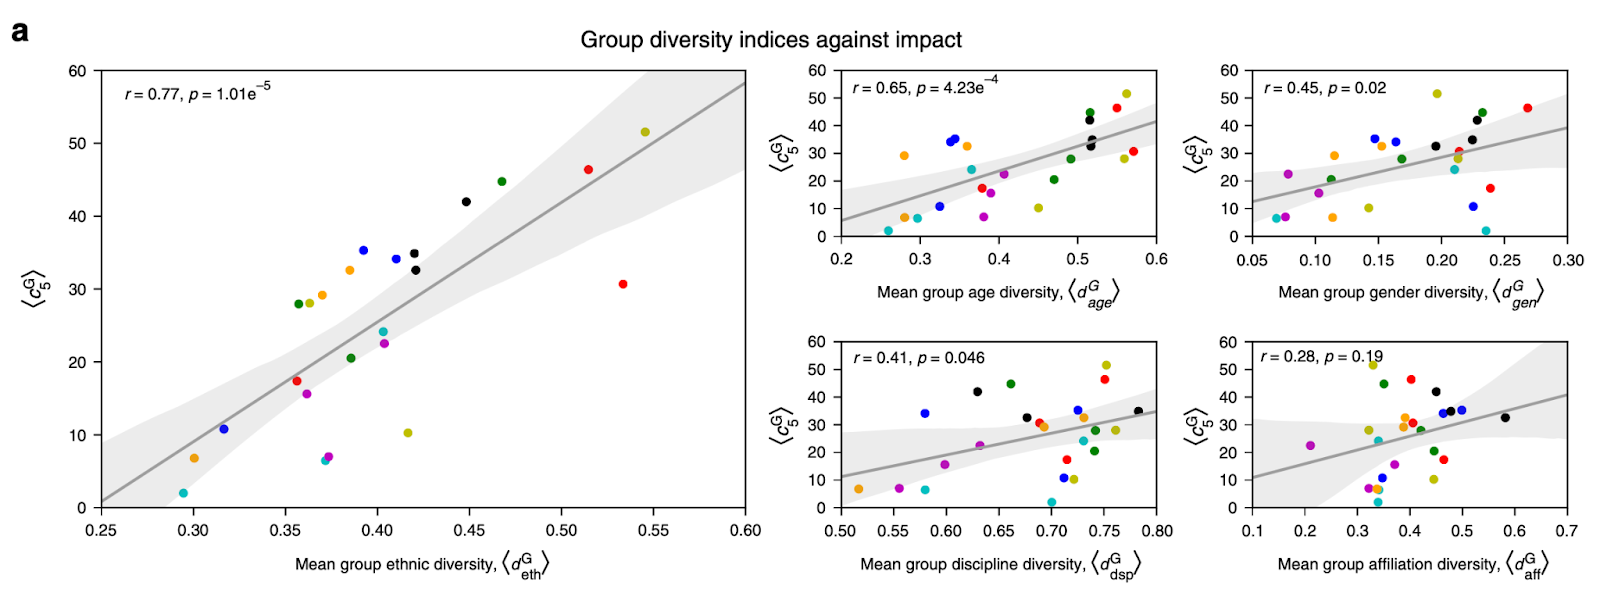
Today’s authors then take this data—the mean diversity index in a given subfield—and combine it with the average 5-year citation count for papers, searching for correlations between the two quantities for each attribute (Figure 3). From this regression analysis, it is clear that there are correlations between diversity (across most of the attributes) and academic impact (inasmuch as citation count is an effective metric of this), with ethnicity showing the strongest trend. Note, however, that though citation count is often quoted as the prototypical marker of an individual’s academic impact, there are other, less quantifiable (and often overlooked) skills—such as mentorship, outreach, teaching, etc.—that contribute to one’s academic success.
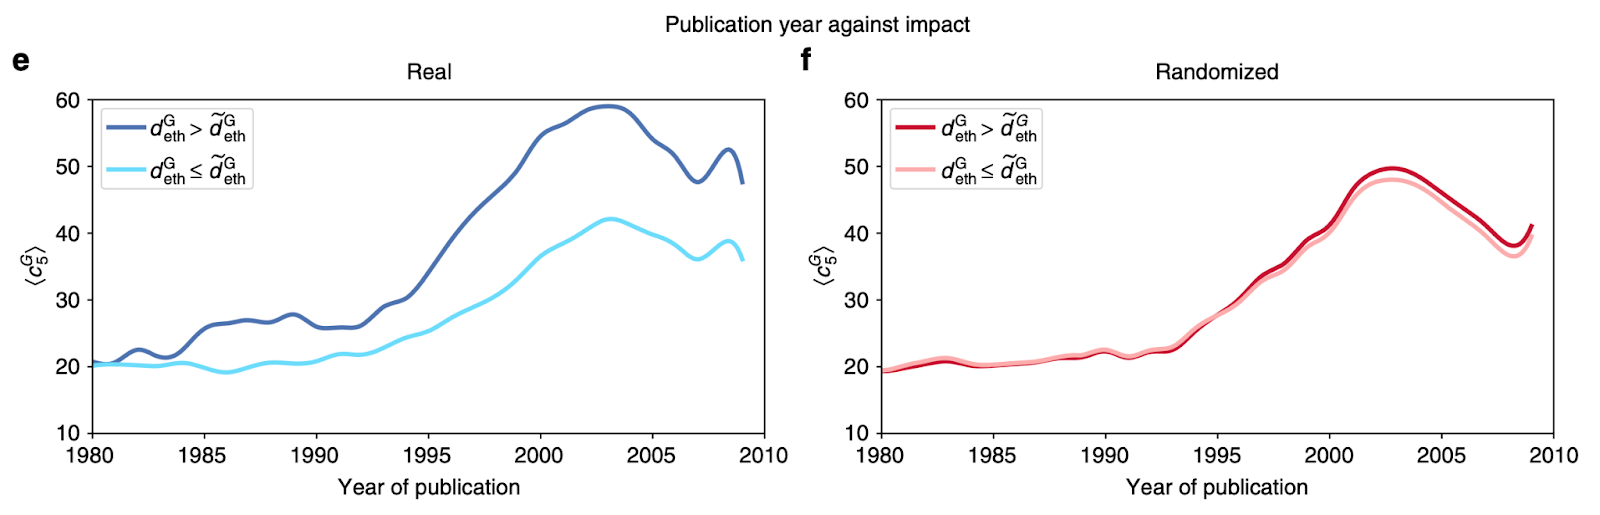
To follow up these results, they separate the papers into two categories: those with an ethnic diversity index below the median value (non-diverse groups) and those above (diverse). They then compare the average citation counts of these two groups in their randomized baseline models, where the ethnicity of the authors are shuffled, to the real data and find that the citation count gains of the more diverse groups disappear (Figure 4).
In sum, the analysis carried out in today’s paper does support the qualitative arguments presented at the start of this bite—diverse teams, whether ethnically or gender-based or otherwise, tend to publish papers with higher impact, suggesting that there is perhaps some link between group diversity and academic impact (though drawing this direction connection is difficult from this analysis alone). In addition, while quantitative work such as this is important, and, in this context, reaffirms the value of diversity in the academy, it is important to keep in mind that the true value of diversity, equity, and inclusion efforts is not derived from or tied to such metrics, and instead is a moral obligation that ought to be independently prioritized.
Astrobite edited by Storm Colloms
Featured image credit: Astrobites Collaboration