Title: Peculiar velocity effects on the Hubble constant from time-delay cosmography
Authors: Charles Dalang, Martin Millon, and Tessa Baker
First author institution: Queen Mary University of London, Mile End Road, London E1 4NS, United Kingdom
Status: Published in Physical Review D [open access]
This Astrobite was featured in episode 90 of Astro[sound]bites! To listen, click here.
We at Astrobites have extensively covered the issue of the Hubble Tension. TL;DR: we have two ways of measuring the rate of expansion of the universe (the Hubble Constant, H0), and they disagree with each other. The first method infers the value of H0 from applying our best model of cosmology – called ΛCDM – to measurements of the Cosmic Microwave Background (CMB), the remnant glow of radiation from the hot plasma that filled the universe in its first 380,000 years of existence. This gives a value of H0 = 67.4 +/- 0.5 km/s/Mpc. The second technique directly measures H0 from measuring the luminosity of ‘standard candles’ such as Type Ia supernovae, or the gravitational lensing of bright, distant objects by closer galaxies (this is known as ‘time-delay cosmography’). These techniques result in H0 = 74.03 +/- 1.42 km/s/Mpc and H0 = 73.3 +/- 1.8 km/s/Mpc, resulting in a strong disagreement of 5.2σ from the CMB measurement.
Many explanations to this discrepancy have been proposed (in fact, the authors of this paper direct the reader towards the ‘H0 Olympics!’), ranging from modified theories of gravity to incorrect model assumptions. In this paper, the authors investigate how mismeasuring the peculiar velocities of an observer, a gravitational lens, and a source of light, can bias your measurement of H0 from gravitational lensing. The peculiar velocity is the velocity of an object relative to the rest-frame of the CMB i.e. relative to the expansion of the universe. For example, as the universe expands, galaxies (typically) move away from each other, and the total velocity at which they move away from each other depends on the expansion rate of the universe plus its peculiar velocity.
When a bright object is lensed by a gravitational potential caused by e.g. a galaxy, it’s possible to see multiple images of that same object. Each image will take a different path through the gravitational potential. Some images travel slightly longer distances, resulting in a time delay when different images reach the observer. If a source varies in brightness over time, such as quasars, that variation will be observed at different times, depending on how far the images of the source must travel. The difference in path lengths contains information on the expansion history of the universe, and therefore it can be used to measure H0. To accurately measure H0, the peculiar velocities of the observer, lens, and source must be precisely known.
Using the CMB, we measure the peculiar velocity of the observer (us!) as 369.82 km/s. We can measure this because we see a dipole in the temperature variation of the CMB. In the direction that we’re moving relative to the CMB, the light of the CMB is Doppler shifted towards shorter frequencies, making the sky look hotter in that direction. In contrast, the opposite hemisphere appears colder because we are moving away from it relative to the rest-frame of the CMB.
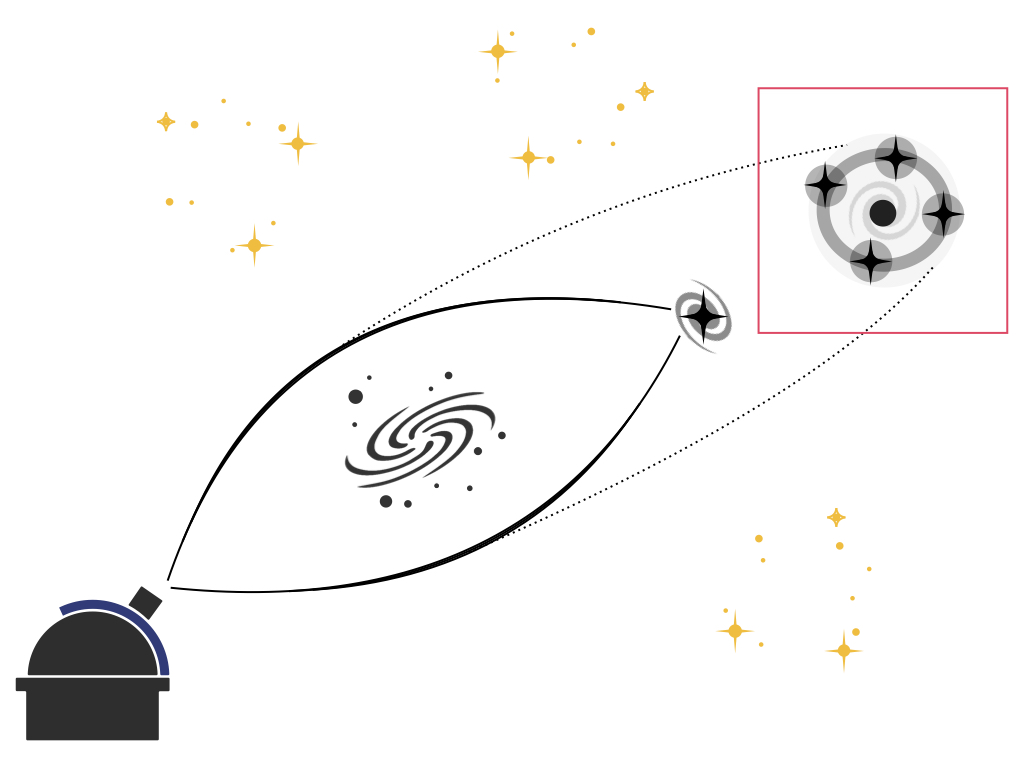
Using the seven lenses from the wonderfully named H0LICOW experiment, the authors set out to quantify the potential bias on the measurement of H0 if the peculiar velocities are incorrectly measured. They first quantify the bias from fixing the peculiar velocity of the observer to the measurement from the CMB. In Figure 2, the normalised bias on the measurement of H0 is shown for each lensed object for different peculiar velocities of the lens and source, where the particular velocities are informed by observation and simulation, with a maximum magnitude of 900 km/s. They find that the bias is no more than 5% percent. This doesn’t account for the difference between the two ways of measuring H0, which needs to be of order 10% for the two techniques to possibly be consistent with each other.
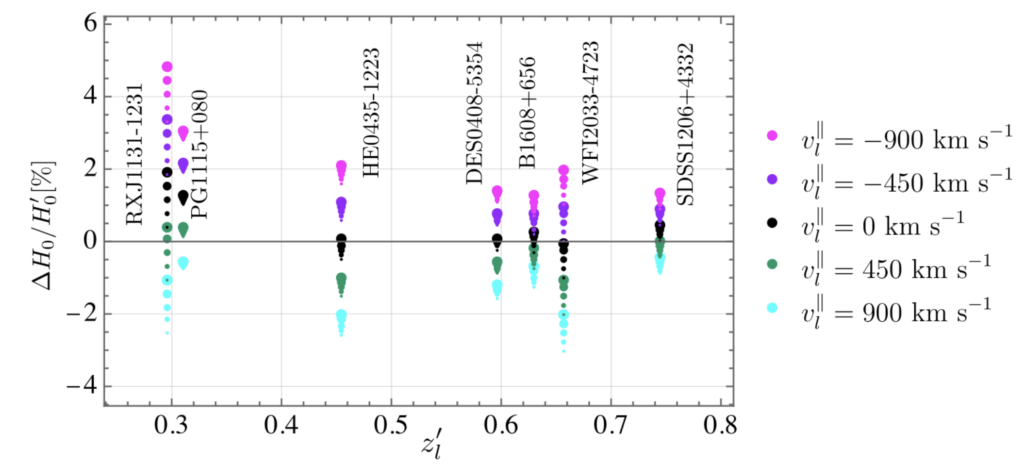
They then investigated what observer peculiar velocity they would require to reach this level of bias. They find a value of approximately 3000 km/s in the opposite direction to the measured observed particular velocity! So that can’t be it. They also tested lens and source peculiar velocities greater than 900 km/s. These velocities could reach these levels of bias, but are not expected to be realistic velocities because they aren’t seen in observations or simulations.
The authors conclude that the bias induced by peculiar velocities on the measurement of H0 using gravitational lensing is important to consider when measuring H0 to a one-percent accuracy. Unfortunately however, it doesn’t explain the Hubble Tension. Holy cow, we have much more work to do to understand this…
Edited by Janette Suherli
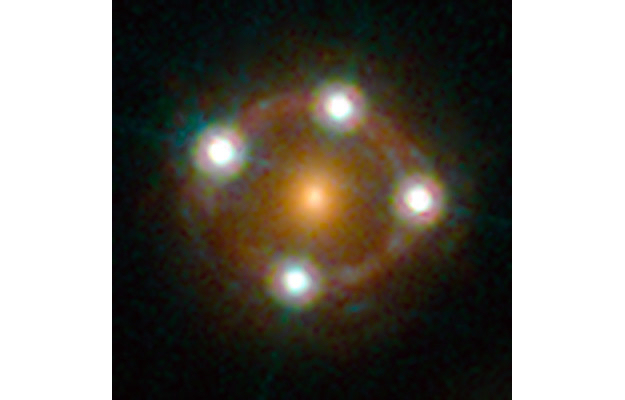
Featured image credit: ESA/Hubble, NASA, Suyu et al.
Using the Pantheon data, the expansion velocity versus distance relationship from 100 Mpc out to 5000 Moc shows a straight line with a slope matching Planck’s 68. The question is the Cepheids and SN1a in the closest 100 Mpc. Our peculiar velocity and the effects of Local Group gravity are good enough to explain the tension for nearby data.