Title: SN H0pe: The First Measurement of H0 from a Multiply-Imaged Type Ia Supernova, Discovered by JWST
Authors: Massimo Pascale, Brenda L. Frye, Justin D.R. Pierel, Wenlei Chen, Patrick L. Kelly, Seth H. Cohen, Rogier A. Windhorst, Adam G. Riess, Patrick S. Kamieneski, Jose M. Diego, Ashish K. Meena, Sangjun Cha, Masamune Oguri, Adi Zitrin, M. James Jee, Nicholas Foo, Reagen Leimbach, Anton M. Koekemoer, C. J. Conselice, Liang Dai, Ariel Goobar, Matthew R. Siebert, Lou Strolger, S. P. Willner
First Author’s Institution: University of California, Berkeley, Berkeley, California, USA
Status: Submitted to arXiv (preprint) and The Astrophysical Journal [open access]
This Astrobite was featured in episode 90 of Astro[sound]bites! To listen, click here.
Cosmological Crisis
Cosmology has a little bit of a crisis. One of its most important parameters, the Hubble constant, seems to have different values depending on how you measure it. The Hubble constant, or H0, characterizes how quickly the universe is expanding. It tells us how fast something is moving away from us given its distance (which is why it has such weird units: kilometers per second per megaparsec). There are two main approaches for measuring H0. One method uses light from the early universe called the Cosmic Microwave Background (CMB), and gives a value of 67.4 +/- 0.6. The other method uses the cosmic distance ladder to look at Cepheid variables in nearby galaxies and gives a value of 73.04 +-1.04. Some quick math will tell you those numbers are different, and crucially their error bars aren’t close to overlapping. This discrepancy is called the Hubble tension, and there’s been a lot of work that’s gone into figuring it out.
The two approaches I shared above are the primary methods that give the most precise values, but there are other ways of calculating H0. Many methods rely on so-called “standard candles” which are objects that all have the same intrinsic brightness. By comparing how bright they look to us to how bright we know they are, we can estimate their distance and measure H0. Others have calculated it using gravitational waves. And today’s paper took a new approach with a fun name: Time Delay Cosmography, which uses gravitational lensing to observe an astronomical transient at various stages of its life. Here’s how it happened.
Finding H0pe
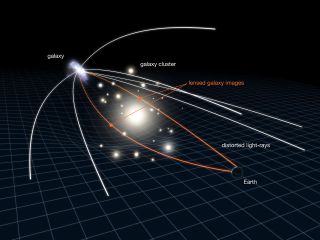
L. Calcada
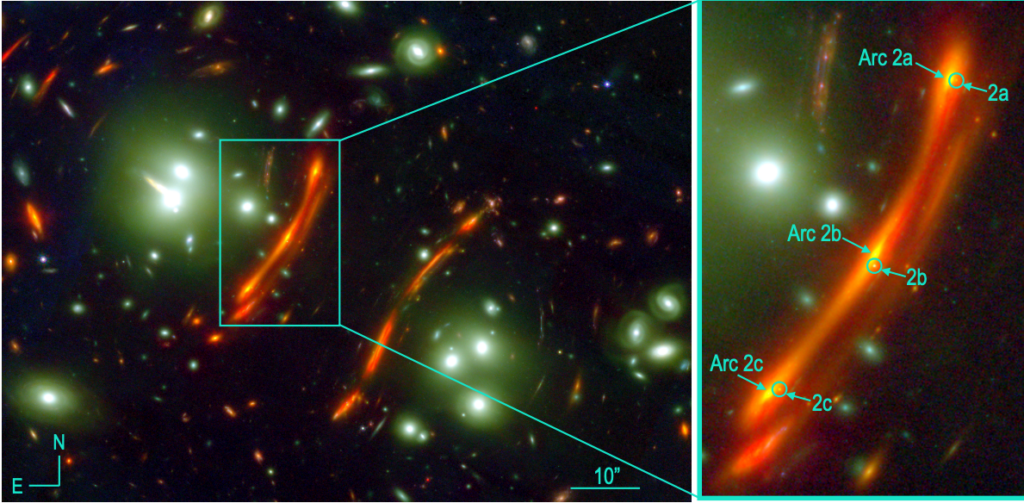
The researchers were processing data they got from JWST back in March 2023 and they noticed something weird. They were looking at a massive galaxy cluster with the poetic name PLCK G165.7+67.0 that is gravitationally lensing several background galaxies. Gravitational lensing refers to the phenomenon wherein the warping of spacetime caused by a massive object (like a galaxy cluster) changes the path light takes across the universe. This does all sorts of fun stuff, like warping galaxies into weird shapes, magnifying them, or even causing them to show up multiple times. So when the researchers were looking at their data, they found one particular lensed galaxy that showed up three times. In that galaxy, they saw a bright spot (see Figure 1).
That spot was a supernova, so the research team quickly requested that JWST look at the cluster again, getting two more observations over the course of the next couple months, including spectroscopic data. They were able to determine that it was a Type Ia supernova, something that happens when a white dwarf gets too big, becomes unstable, and explodes. They named it SN H0pe, and here’s where the analysis gets really cool.
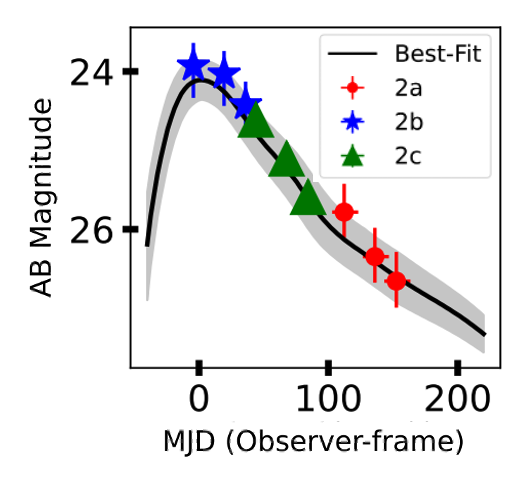
When a gravitationally lensed object shows up multiple times, that means its light has taken multiple different paths around the massive system doing the lensing. As shown in Figure 2, sometimes these routes have different lengths, which means when we observe multiple images of a lensed object we’re actually seeing it at different times. If the object that’s being lensed is something that varies in brightness over time, say a supernova, we can get a good idea of how much delay there is in between images. So in this gravitationally lensed galaxy they saw the same supernova at three different stages of its evolution, and when you include the follow up observations they had nine data points, spanning nine different moments in time, as shown in Figure 3. This allowed the researchers to calculate the delay between the three lensed images of this galaxy. In addition, they could calculate the expected delay by generating a model of the lens; they modeled how the massive foreground cluster warped space. These two things–getting a delay from the supernova light curve and from the lensing–were done by separate groups and the process was blinded as a way to eliminate bias in the results. Eventually, the groups shared their results and by comparing the time delay from each method they were able to calculate the Hubble Constant!
Crisis Solved?
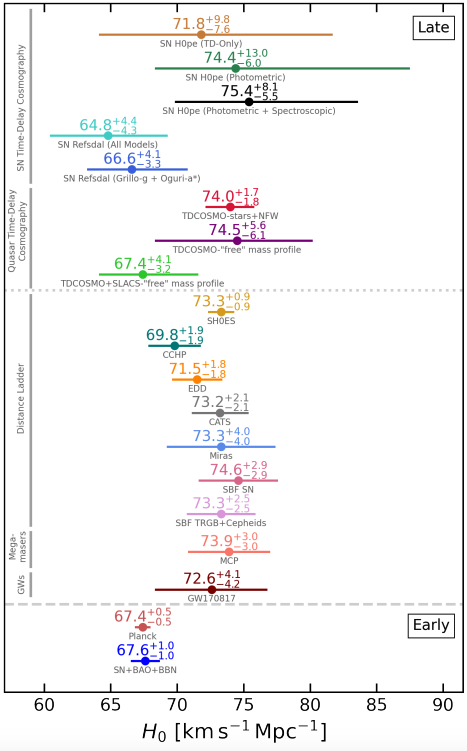
So where does it stack up? Well, in Figure 4 you can see the Hubble constants they measured in the top three points (the multiple answers come from using different data sets and depend on whether they included magnification effects). Their most precise value is 75.4+8.1/-5.5, which has large enough error bars that it’s hard to conclusively determine how it compares to other H0 calculations. However, the team will be looking at this galaxy again once the supernova has completely faded to get even more accurate brightness measurements, and they’re scanning the sky for more multiply imaged Type Ia SNe. With just a few more, they’ll be able to bring their error bars down into a competitive range with the CMB and Cepheid data.
This was only the second use of Time Delay Cosmography to calculate H0 from supernova observations, and it was the first time this method was used with a Type Ia supernova. It’s a fairly new method, but one that shows great promise for helping resolve this cosmic crisis with future observations.
Astrobite edited by Megan Masterson
Featured image credit: Pierel et al. 2024
Unfortunately it appears that figure 4 is not loading. Seems like a broken link?
Also, how does it solve the Hubble tension? It’s even higher than the cosmic distance ladder approach? I thought untensing the Hubble tension would mean bringing the two approaches closer together?
Hi! Hopefully the figure is fixed now. Regarding fixing the Hubble tension, since the error bars are so large this technique as of now does not present a possible solution or reconciliation. It remains to be seen how this approach helps/worsens the Hubble tension right now.