Title: Dynamic Cosmography of the Local Universe: Laniakea and five more watershed superclusters
Authors: A. Dupuy and H. M. Courtois
First author institution: Korea Institute for Advanced Study, Republic of Korea
Status: Published in Astronomy and Astrophysics [open access], 2023
Cosmography is the science of cartography, but applied to the Universe by mapping out the Large Scale Structures such as voids, filaments and superclusters. While galaxy surveys are able to create such maps from just looking at spatial information from galaxy surveys, useful information for such a task is also available in the peculiar motions of galaxies. These are specifically, the motions of galaxies that arise due to their local gravitational interactions with nearby matter. This information allows us to explore how matter is moving in and out of regions of space, hence allowing for dynamical cosmography.
This bite provides an update to a previous bite where peculiar velocities of galaxies and spatial data are used to map the Local Universe. Here, a measurement and mapping of the gravitational field in the volume of the largest combined peculiar velocity catalogue to date, CosmicFlows-4, is used for the analysis. The authors use the peculiar velocity data to define and partition the volume of space into basins of attraction (attractors) and basins of repulsion (repellers) – regions of coherent motion inwards (such as towards a massive cluster of galaxies) and outwards (such as from a void) respectively, due to gravity.

Mapping the Field
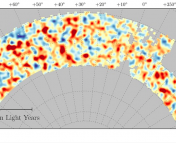
Firstly, the authors take two existing 3D datasets to create reconstructions of the velocity (gravitational) field, in the literature, to do the analysis: the CosmicFlows-4 (CF4) velocity data for all the galaxies and data for groups of galaxies within the CF4 catalogue. The reconstruction of the field involved taking the available data and an assumed cosmological model that predicts the gravitational field, which in this case is assumed to be the standard model of cosmology, CDM. Then, a method is used to determine the underlying velocity field that minimizes the variance in the observed field with respect to the expected field of the assumed model. A filter that minimizes this variance is called the Wiener Filter. Further, the data and model is used to find best fit parameters for the cosmological model simultaneously via an algorithm called Hamiltonian Monte Carlo — this is a kind of Metropolis Hastings algorithm, which is a kind of algorithm used to explore probability distributions for parameters that are otherwise hard to sample. The gravitational field of CF4 is constructed with this technique in a grid and the results can be seen in Figure 1.
Streamlines, which represent the trajectory of particles and thus are tangent to the value of the velocity field at each point, can be found in each grid cell (called voxels). These are used to identify attractors and repellers, which are identified as the end points of streamlines (from moving along the streamline in the positive or negative direction respectively). Voxels with a higher density of streamlines passing through them can be identified as areas of higher mass density – similar to with magnetic field lines, the field strength is greater at points where more field lines pass through.
Defining boundaries of Large Scale Structures
Figure 2 shows the resulting nine basins of attraction identified in the ungrouped CF4 data (with a 3D interactive visualization available from the authors here), of which six correspond to known superclusters. Laniakea, shown in red, is our local supercluster in which the Local Group (and – internal to this – the Milky Way) resides. They measure the volume of Laniakea to be around Mpc
.
In the grouped data, Laniakea is not separated from the Shapley attractor, and an identified supercluster Apus is also not identified as an individual attractor. However, Lepus, Hercules, Perseus-Pisces and Shapley are identified consistently between both datasets showing consistency, although in some cases the volume of the basins differ between the different analyses. Furthermore, due to the limiting resolution of the field reconstruction, the positions of the basins do not always match the known coordinates of the clusters from their measured redshifts precisely.
Aside from the six basins mentioned, other basins were identified in the data that mainly comes from the contribution of peculiar velocities measured from the Sloan Digital Sky Survey (SDSS) data, that accounts for a significant portion of the CF4 catalogue and extends to further distances than the other datasets in the compilation. This portion of the data may be responsible for the variation of the reconstructed fields shown in Figure 1, since there tends to be more emphasis on this data in the grouped catalogue. As a result, more basins are also identified in the grouped data than the individual galaxy data where just three basins are identified. However, due to the SDSS data being at the edge of the volume of the reconstruction, these basins are perhaps less well constrained overall.

Three repellers were also identified in the analysis of the ungrouped data, which correspond with the position of the Sculptor Void, the Bootes Void and one that appears as a combination of two previously identified repellers; the Cold Spot Repeller and the Dipole Repeller. In the grouped data, a repeller was found in the region corresponding with a suspected galaxy supercluster named Vela that hides in the Zone of Avoidance; this corresponds to the part of the sky where it is difficult to observe galaxies as the plane of the Milky Way gets in the way of our view. Vela is a suspect for driving large galaxy velocity flows that have been observed.
Summary
Future surveys like WALLABY, DESI and 4HS will give us more information about the velocity field by measuring peculiar velocities in parts of the sky and go to greater depths, that will complement the CosmicFlows-4 data. Specifically, 4HS will give us information from the opposite direction to the SDSS data, focusing more on the southern hemisphere rather than the northern hemisphere of our sky. This additional data will allow us to further infer what superclusters may be responsible for the flows of galaxies in our local Universe, by having a more homogeneous map of the sky and continue to test how well our cosmological models are able to predict the size and distribution of large structures in the Universe.
Edited by Cole Meldorf
Featured image credit: Pablo Carlos Budassi, CC BY-SA 4.0 <https://creativecommons.org/licenses/by-sa/4.0>, via Wikimedia Commons


