Authors: Bradley E. Schaefer
First author institution: Department of Physics and Astronomy, Louisiana State University, Baton Rouge, Louisiana, 70820, USA
Status: Published in MNRAS (open access)
And
Authors: Bradley E. Schaefer (Louisiana State Univ.), Brian Kloppenborg (AAVSO), Elizabeth O. Waagen (AAVSO), and the AAVSO observers
Status: Published as an Astronomer’s Telegram (open access)
Within the the Coronae Borealis constellation — aka, the “Northern Crown” — is a unique and exciting system: the cataclysmic variableT Coronae Borealis (T CrB). Cataclysmic variables are binary systems that consist of a white dwarf and a companion star, which is usually a main sequence star or a red giant. The white dwarf and companion orbit very close to one another, so close that the white dwarf begins to accrete (eat) material from the companion star. When they’ve slurped up enough material, a runaway thermonuclear reaction ignites on its surface, causing a bright flash of light, which is called a nova.
Some of these novae, including the one in today’s paper, have multiple outbursts, and are thus called recurrent novae. T Corona Borealis (T CrB) is very bright at the peak of the nova outburst, usually around 2.0 magnitudes (for reference, Polaris, aka the North Star, is about this brightness). We have brightness measurements for this nova going back two eruptions, one in 1866 and another in 1946, as well as evidence for even earlier eruptions as far back as the early 1200s!
T CrB is particularly exciting right now: its white dwarf has been steadily eating at the buffet that is its companion, and is now nearly full – we expect it to erupt very soon! Today’s paper compiles observations of this nova for the past 150+ years and predicts its next outburst. The author of this paper also sent an Astronomer’s Telegram (second link above), a type of real time astronomical notice to the community, narrowing the predicted window for the eruption to between mid-February and mid-September, 2024.
Observations of a well-loved system
T CrB has been studied by many, often amateur, astronomers who have logged their countless hours of observations on the American Association of Variable Star Observers (AAVSO) database. These observations span from 1855 to 2022, covering the two eruptions of the nova.
The observations are primarily in two wavebands: visual, and photographic. The author converts all of these to the standardized Johnson V and B band magnitudes in order to develop a full light curve for the source. Prior to the development of modern electronic detectors, people could use photographic plates to capture the brightness of stars in the sky. By examining these plates and later data from electronic detectors, the author converts measurements of this system into the B band, in addition to the visual. The resulting light curve can be seen in Figure 1.
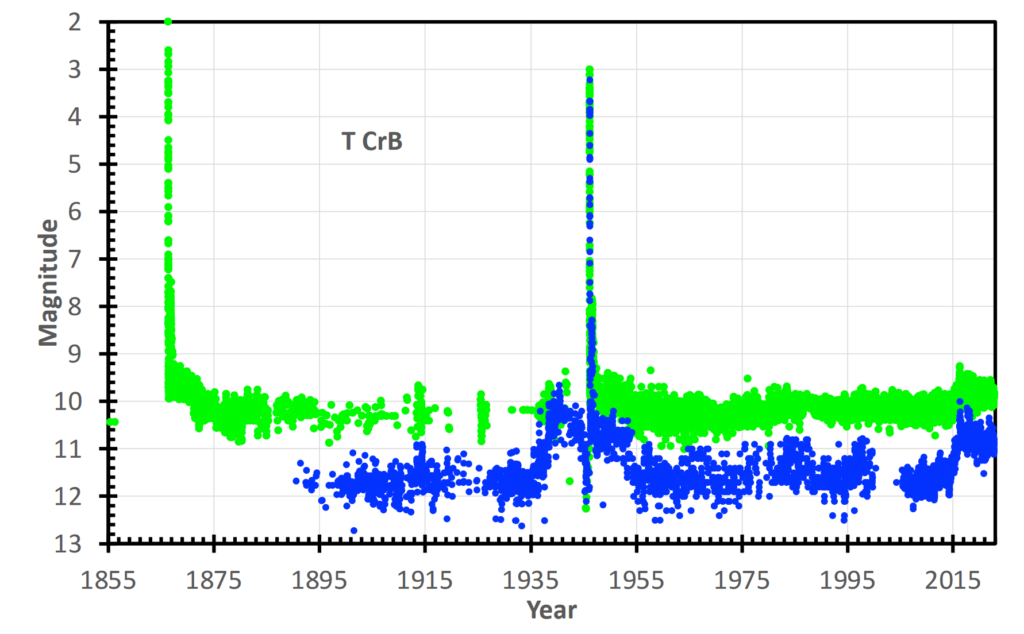
By doing this conversion and detailed light curve study, we can begin to understand more about this system. For instance, the red giant and the white dwarf’s orbital period is measured to be 227.6 days, and the system has quite a bit of variability, seen as flickering.
The unique fingerprint of T CrB
T Coronae Borealis has some very unique features to its light curve, which appear to be very rare among novae. The author describes 3 unique signatures:
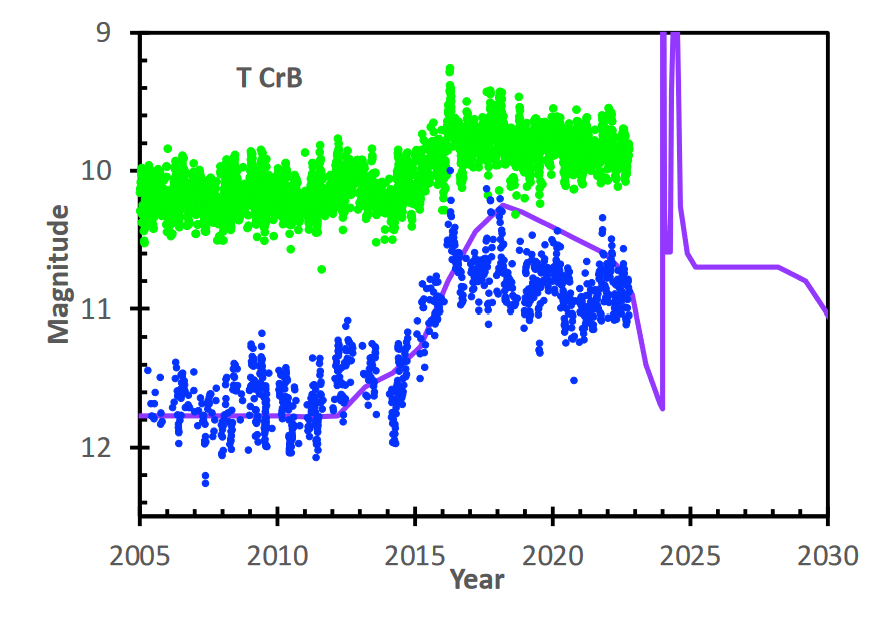
1 – A high state. About 10 years before the nova erupts (and 9 years after), it brightens into a high state. This is likely caused by an increased accretion rate, where the white dwarf begins gobbling more material from its companion star. The most recent high state began in 2015.
2 – A pre-eruption dip. About a year before the nova erupts, it suddenly drops in brightness as it spews out some material into the space around it (almost like a prolonged burp), which partially obscures its brightness. This feature is unique to this nova, and is not shared by any other system. The most recent dip began in April/May of 2023.
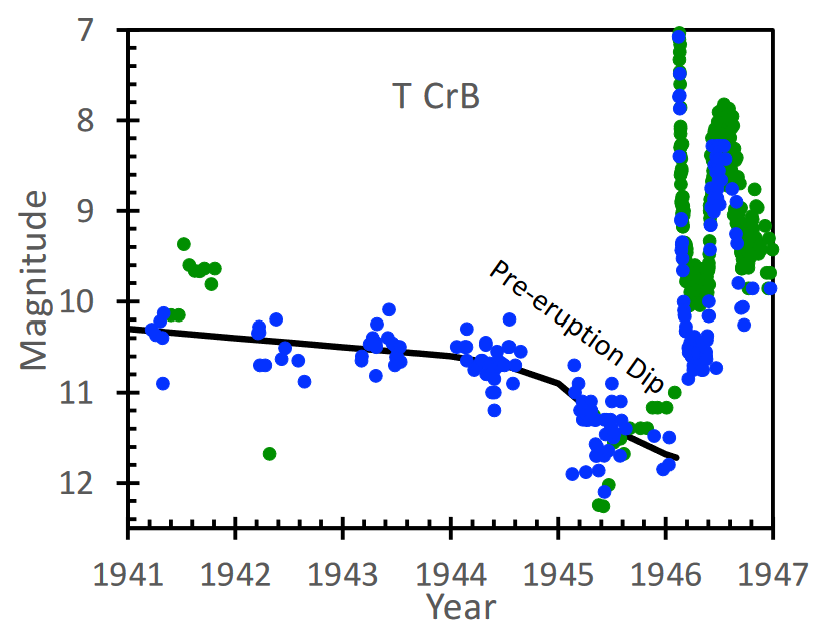
3 – A double eruption. The nova first erupts once, then decreases to the brightness it had before erupting, followed by a second outburst. The author speculates that this is a second outburst of the nova, where it accretes some more material before erupting again and then settling down.
All 3 of these features were seen in the previous eruptions, and can be seen in the 1946 light curve shown in Figure 2.
Predicting the explosion
So, how can we predict when this system will go nova? Most of the time, when we talk about transient sources (such as supernovae, gamma-ray bursts, or others), we have no way to predict when it will happen. Luckily, this nova has a unique fingerprint that gives us ways to estimate when it will erupt.
When this paper was published, the nova had been in its high state since 2015. By taking the 1946 eruption as a template and shifting it to match current data, the author could get an estimate (with uncertainty) of when the nova would erupt (shown in Figure 3).
However, in April/May 2023, T CrB began its pre-eruption dip. This dip provides a tighter window for when the eruption might happen, which was published in the Astronomer’s Telegram. There may still be some variation on this predicted outburst, but this gives a good estimate to when the eruption may occur.
Ultimately, we may see an exciting nova soon – and it should be visible with the naked eye! The predicted outburst falls anytime from now through mid-September 2024. Many astronomers are on the edge of their seats in anticipation of this exciting event!
Astrobite edited by: Keighley Rockcliffe
Featured image credit: created by Keighley Rockcliffe