Title: JWST Reveals a Surprisingly High Fraction of Galaxies Being Spiral-like at 0.5 ≤ z ≤ 4
Authors: Vicki Kuhn, Yicheng Guo, Alec Martin, Julianna Bayless, Ellie Gates, AJ Puleo
First Author’s Institution: Department of Physics and Astronomy, University of Missouri, Columbia, MO, USA
Status: Published in the Astrophysical Journal Letters [open access]
When did the first spiral galaxies form? Likely much earlier than we thought! In the age of the James Webb Space Telescope (JWST), we can see further and more clearly into the past than ever before – which as today’s paper shows, requires us to rethink some theories of the formation and evolution of spiral galaxies. Specifically, today’s authors tracked the “spiral fraction”, the ratio of spiral galaxies to total number of galaxies, throughout time and found that there are more spiral galaxies at earlier times in the universe than previously expected.
The Spiral Fraction
To obtain the spiral fraction, the authors needed a sample of all visible galaxies at different cosmic times in a region of the sky. The sample of galaxies was imaged by JWST’s Near-Infrared Camera (NIRCam) for the Cosmic Evolution Early Release Science (CEERS) Survey. Galaxies that had been previously analyzed from the Cosmic Assembly Near-IR Deep Extragalactic Legacy Survery (CANDELS) were selected as they had known photometric redshifts and stellar masses. From there, galaxies with masses above \(10^{10}\) solar masses were divided into redshift bins ranging from z = 0.5 to z = 4, and an image was constructed for each galaxy in its rest-frame V band (visible light prior to being redshifted). Each of the 873 galaxy images was visually inspected to determine whether or not the galaxy was a spiral.
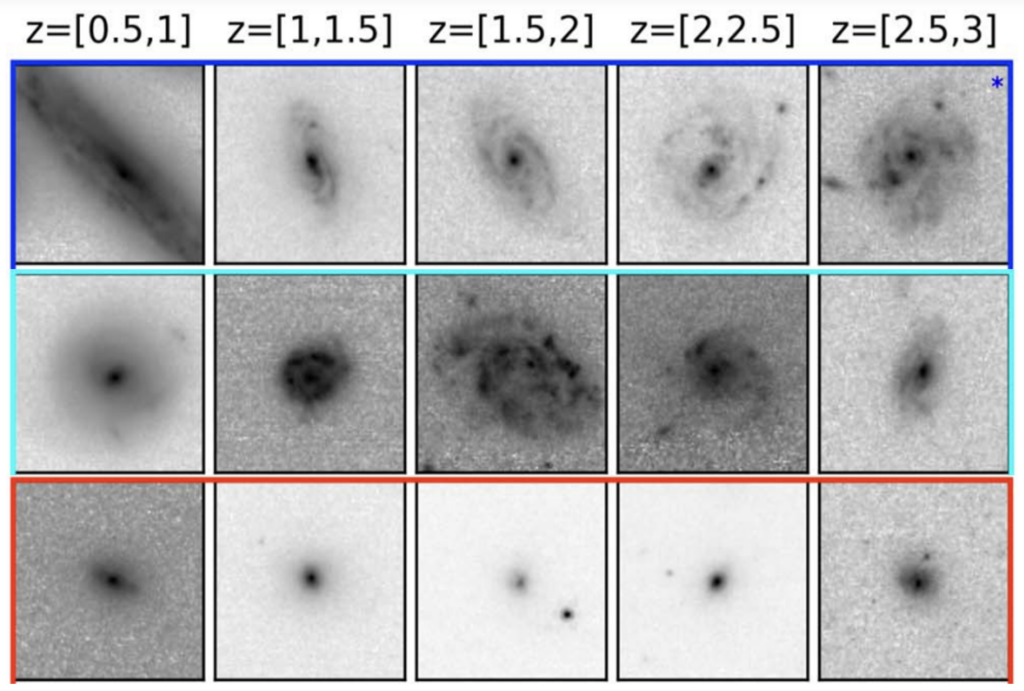
In order to reduce personal bias, each of the 6 coauthors separately inspected each image and voted “yes” or “no” for whether they thought it was a spiral galaxy. (Bootstrapping analysis additionally confirmed that nobody had been heavy-handed in their voting preferences.) If at least 3 people voted “yes”, then a galaxy was a confirmed spiral, and the spiral fraction was calculated in each redshift bin. They also calculated the probability decision fraction, or the likelihood that a random galaxy is a spiral, by taking the ratio of “yes” votes to the total number of votes in each redshift bin. Figure 1 shows example galaxy images along with how many authors voted “yes” to them being spiral galaxies.
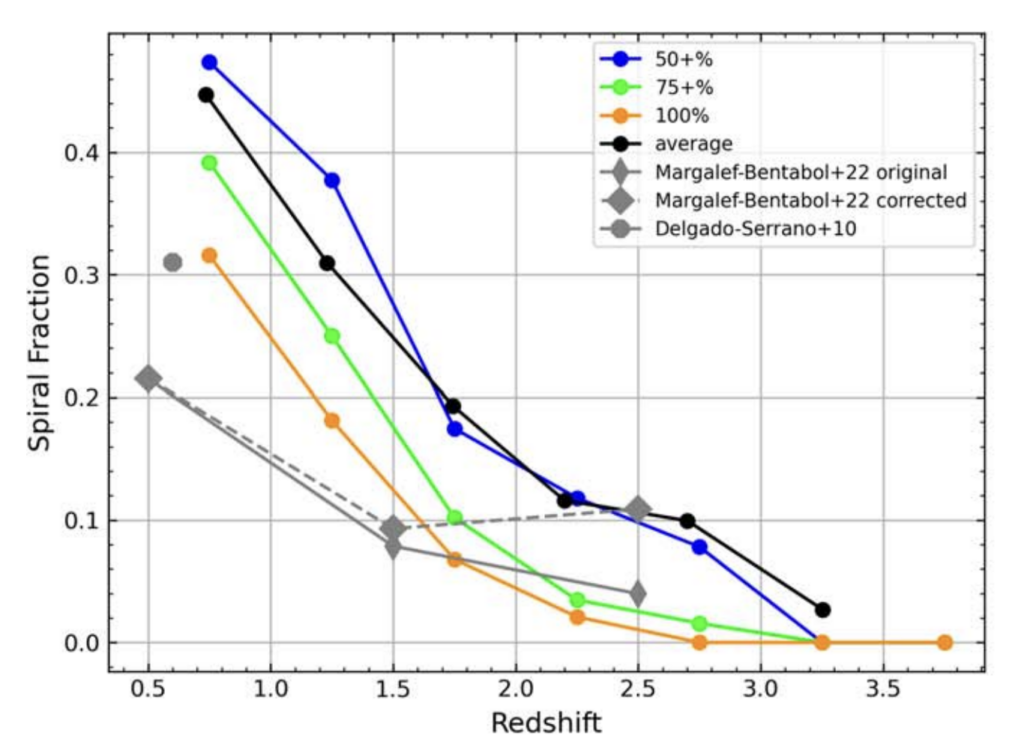
Figure 2 shows an initial look at the spiral fractions throughout time compared to previous estimates made using Hubble Space Telescope (HST) images. The new JWST spiral fractions are higher than HST’s, as expected due to JWST having much higher resolution and sensitivity, but at low redshifts the new spiral fractions are more than double!
The Intrinsic Spiral Fraction
Due to a number of observational effects including cosmological dimming and the sensitivity of observations, it is likely that some spiral galaxies were missed (specifically small spirals and spirals with weak arms at high redshifts) which results in the observed spiral fraction being lower than the true value. To counter this, the authors developed a method to estimate the intrinsic spiral fraction by artificially redshifting known spiral galaxies to statistically understand how often spiral features are lost.
From the lowest redshift bin, where spirals and non-spirals were easily classified, galaxy images were adjusted to make the galaxies appear further away which involved decreasing the flux, making them smaller, and blurring them to account for the differing point spread function. Figure 3 shows examples of artificially redshifted galaxies. These new images were used to create subsamples with varying intrinsic (known) spiral fractions, and the voting process was repeated to get a sense of how many spirals were lost. This way, for any observed spiral fraction, they could estimate the intrinsic spiral fraction to be the same as that of the subsample that produced it.
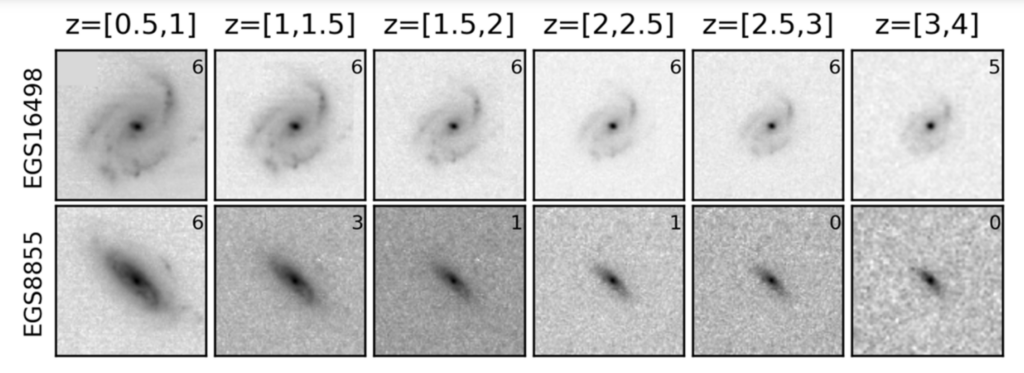
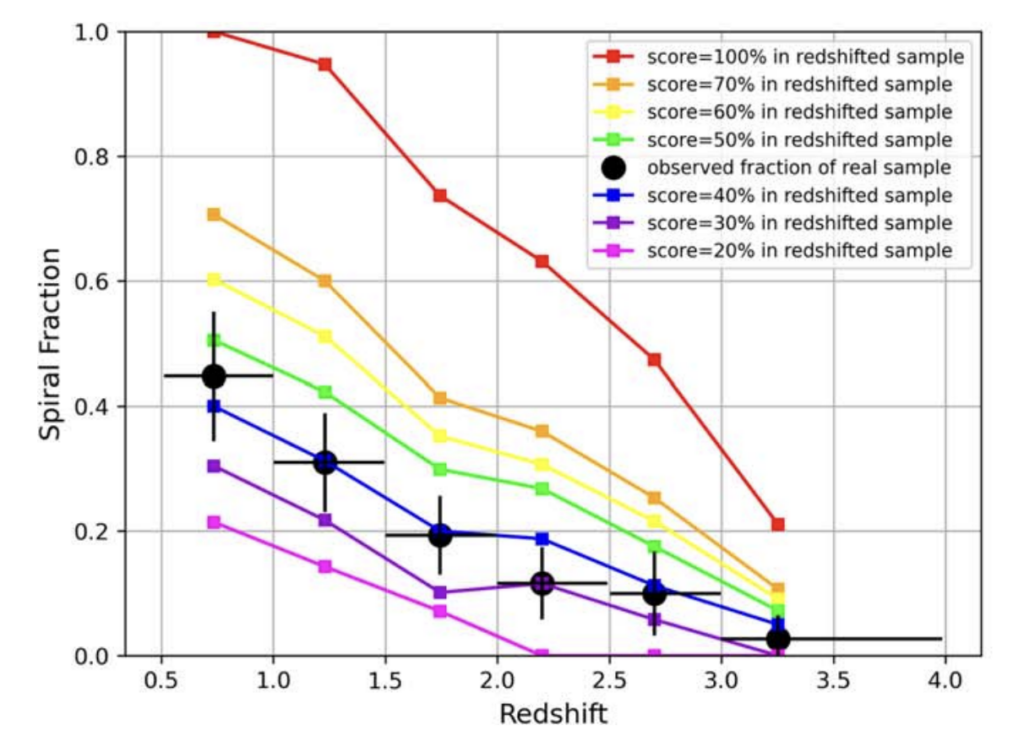
Figure 4 shows that an intrinsic spiral fraction of about 40% is a good match to the observed spiral fraction of the data at all redshifts. Additionally, the lower limits, provided by 3 sigma errors, are higher than in any previous works.
What does this mean for spiral galaxy evolution?
The high fraction of spiral galaxies at high redshifts supports the scenario that many spiral galaxies formed at least 12 billion years ago and settled to dynamically cold, thin disk spirals like the Milky Way around a billion years later. For context, very few spiral galaxies were known to be older than 8 billion years before we had the powerful sight of JWST. Understanding when and how spiral galaxies formed helps to answer big questions, like how the universe evolved as a whole, and still-big-but–slightly-smaller questions, like piecing together the mechanisms that formed spiral arms. Realizing spiral galaxies are older than we thought brings us one step closer to understanding spiral galaxy evolution – another win in the books for JWST.
Astrobite edited by Skylar Grayson
Featured image credit: Pablo Carlos Budassi, licensed under CC BY-SA 4.0