Authors: T. M. Stanton, F. Cullen, A. C. Carnall, D. Scholte, K. Z. Arellano-Córdova, D. J. McLeod, R. Begley, C. T. Donnan, J. S. Dunlop, M. L. Hamadouche, R. J. McLure, A. E. Shapley, C. Bondestam, S. Stevenson
First Author’s Institution: Institute for Astronomy, University of Edinburgh, Royal Observatory, Edinburgh
Status: Submitted to MNRAS [open access]
Every star is made of the stars that came before it. The first generation of stars, made of the hydrogen and helium formed in the Big Bang, fused those atoms into heavier elements, then exploded, scattering atoms from oxygen to iron across the Universe. The next generation of stars condensed out of that material, and the cycle repeated.
By now, the interstellar medium in our Milky Way is enriched with the products of several generations of supernovae, but how and when exactly our Galaxy and its neighbors evolved to contain those elements is still an open question. Luckily, we can use JWST to look back in time! High-redshift galaxies allow us to see what our galactic ancestors might have looked like, answering important questions of how they formed and evolved.
Ancient chemistry
Today’s authors use JWST’s NIRSpec instrument to observe nine galaxies with redshifts between 1.8 and 5.3, meaning that we observe them as they were between about 1.1 and 3.6 billion years after the Big Bang. Because these galaxies are so old, the authors expect them to align with models of the early stages of galaxy formation. They test this by measuring the abundances of two different elements within their sample: argon and oxygen.
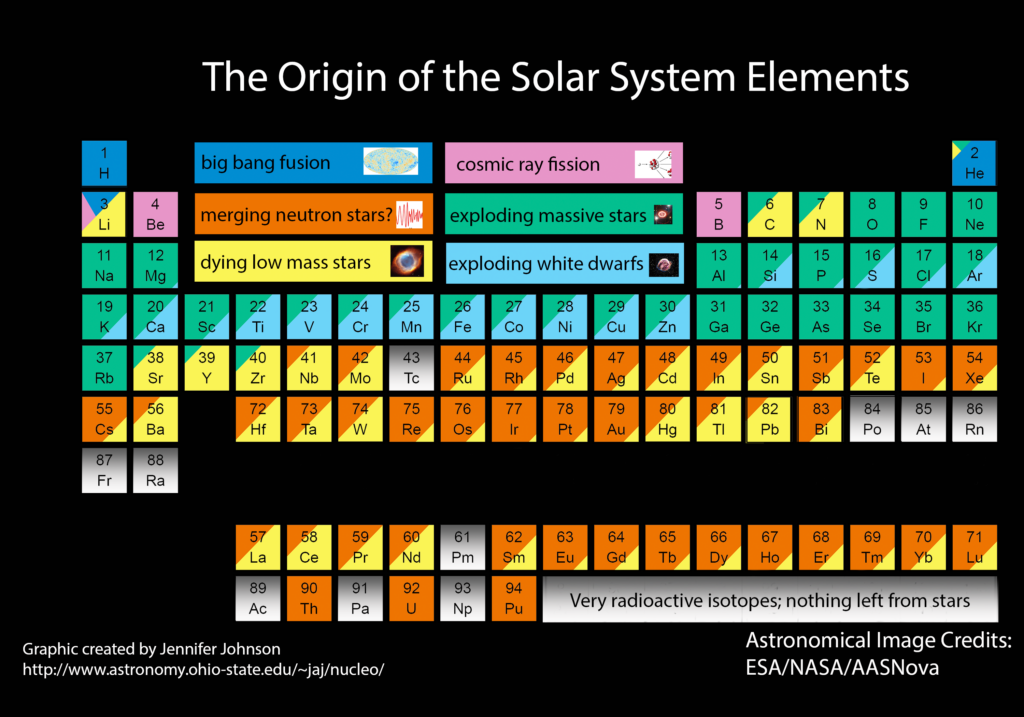
Many atoms are created in the high-energy environment of a supernova, as shown in Figure 1, but different types of supernovae produce different elements. In particular, astronomers are interested in comparing the alpha elements, produced through the alpha process in core-collapse supernovae (CCSNe), to elements produced in type Ia supernovae (SNe Ia). CCSNe are the deaths of massive stars, which typically burn fast and hot, and therefore they tend to happen early in a galaxy’s lifetime. SNe Ia, on the other hand, happen when white dwarfs accrete matter from a binary companion until they pass a mass threshold and explode. White dwarfs themselves are the remnants of dead stars, so the circumstances allowing a type Ia supernova take a while to set up; the delay time between CCSNe and SNe Ia is around a billion years. Older galaxies should therefore have experienced relatively few type Ia supernovae and many core-collapse supernovae, and the abundances of elements produced in these events are proxies for the history of a galaxy’s evolution.
Traditionally, a galaxy’s iron abundance is used to measure its enrichment through SNe Ia. However, iron’s most prominent spectral lines are found at wavelengths that are difficult for JWST to measure accurately, so today’s authors turn to argon as another element produced through both CCSNe and SNe Ia. They compare its abundance to the alpha element oxygen.
Predicting the past
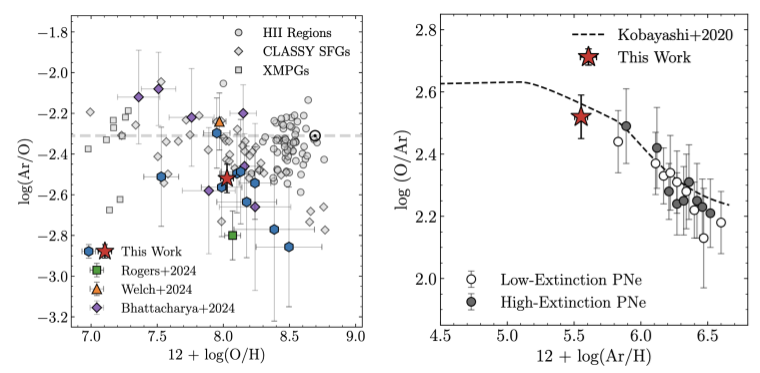
As can be seen in the left panel of Figure 2, the authors do indeed find that the ratio of argon to oxygen in their sample is significantly lower than the abundances we observe in local galaxies! This fits perfectly with the prediction from galaxy evolution models that older galaxies should be composed of the products of both core-collapse and type Ia supernovae, while younger galaxies should only contain the products of CCSNe. By comparing abundances in local galaxies to high-redshift galaxies, the authors can predict that about 34% of argon in the local Universe was created in SNe Ia.
When we plot an alpha element’s abundance with respect to the abundance of an element produced in SNe Ia, as the authors do on the right side of Figure 2, we expect the curve to have a characteristic “knee” shape. The SN Ia element abundance can be seen as a rough proxy for the galaxy’s age, so the alpha abundance with respect to it stays constant until the point at which the galaxy starts experiencing a large number of SNe Ia, and then drops off. When we compare the weighted average of the authors’ results to this model’s predictions, we see that the galaxies analyzed in today’s paper sit roughly at this knee point, right where we would expect for a set of galaxies just old enough for their white dwarfs to be about to explode!
These results are very encouraging, and indicate that at least some galaxies in the early Universe evolve exactly how we would expect them to. There may still be plenty of mysteries to unravel when it comes to galaxy evolution, but we’re on the right track!
Astrobite edited by Suchitra Narayanan
Featured image credit: From Figure 1 in today’s paper