Authors: I. Kolesnikov1, V. M. Sampaio2, R. R. de Carvalho3, C. Conselice4
First Author’s Institution: Independent researcher1, Universidade Cidade de São Paulo2, University of Manchester3, Universidade de São Paulo4
Status: Currently only pre-print available on arXiv
Galaxies come in all shapes and sizes. Morphologically, they can be separated into three broad classes. There are disk galaxies, which are flat like a frisbee, and include spiral galaxies such as our home the Milky Way. There are also spheroidal galaxies, which are rounder and more bulbous, such as early-type elliptical galaxies. Finally, there are the galaxies that don’t fit into either category, which astronomers refer to as irregular galaxies.
While at first glance this may seem straightforward, the proportion of galaxies in each group has not remained constant throughout cosmic time. In fact, understanding how galaxy structure has changed during the Universe’s lifetime is one of the key questions of galaxy evolution. Moreover, since the shape of a galaxy often changes as it collides or interacts with its neighbours, studying how galaxy morphologies evolve can help us probe when and how galaxies merge. However, as the authors of today’s paper will show, precisely how you study galaxy morphologies can have significant effects on the results you get.
Hoping to help piece together this galaxy-sized puzzle, the authors of today’s paper assembled a sample of galaxies from the Cosmic Assembly Near-infrared Deep Extragalactic Legacy Survey (CANDELS), and applied a machine learning algorithm to classify the sources into distinct morphological groups. From CANDELS, they selected galaxies with masses greater than 109 times the mass of the sun, or 109 M⊙, to ensure dwarf galaxies did not contaminate their sample. In addition, they only selected sources with redshifts between 0.2 and 2.4, corresponding to galaxies that were observed as they were between ~2.5 and ~11 billion years ago. In total, this amounted to 16,718 galaxies, which they separated into redshift bins of 0.2 to track how galaxy morphology varies with redshift.
Next, the authors constructed their machine learning algorithm. As input, they use the MEGG system, which comprises four metrics, namely the second moment of light (M20), entropy (E), the Gini coefficient (G), and the second gradient moment (G2). All of these metrics measure something about the distribution of light in the galaxy images. In particular,
- M20 measures how centrally located the brightest regions of the image are (with spheroidal galaxies having more centrally concentrated emission and hence higher M20 values),
- E characterises the randomness associated with each image’s information content (meaning spheroidal galaxies have lower entropy than disk galaxies),
- G measures the relative flux distribution across pixels (so a high G value implies much of the light is concentrated in a small number of pixels as in spheroidal galaxies, while a low G implies a more even distribution), and
- G2 reflects the degree of asymmetry in the image.
To the metric, the authors applied a self-organising map, a form of unsupervised learning which does not require human input to label the training dataset and instead discovers patterns on its own. This separated the data set in each redshift bin into groups with similar values of M20, E, G, and G2. From these groups, those with the most distinct values and hence defined morphologies were labelled as either disk or spheroidal galaxies.
Next, the authors used the results of this initial stage of unsupervised learning to train their supervised deep learning algorithm, a convolutional neural network. This classified the full sample of galaxies that weren’t selected as part of the training set in the unsupervised stage into disk, spheroidal, and irregular groups.
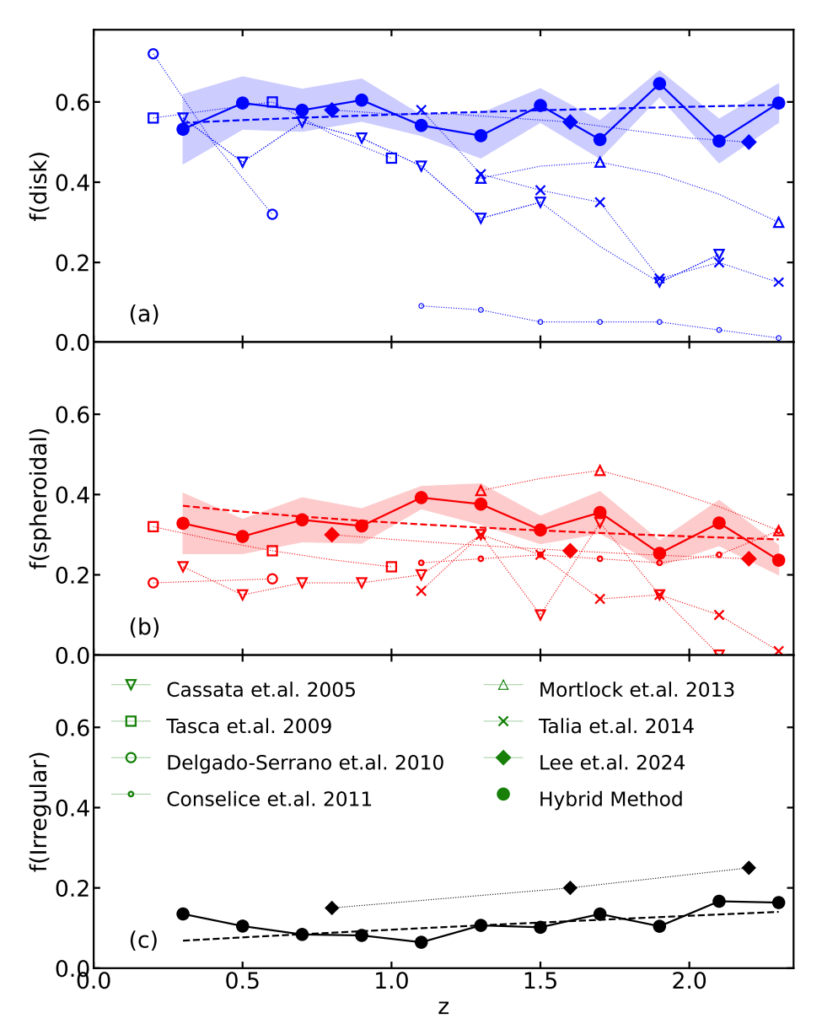
The results from the output of the convolutional neural network are presented in Figure 1, which gives the fractions of each morphological class as a function of redshift (filled circles). In Figure 1, filled symbols indicate studies that relied on a machine learning algorithm, while empty symbols are those which employed visual classification done by humans. From their analysis, the authors found that the fraction of disk and spiral galaxies does not vary with redshift, staying at a roughly constant ratio of 1:2, in contrast to previous studies.
Following this, the authors compare their classifications across the different redshifts to previous studies. Evidently, the fraction of each class varies depending on the method that is used as well as the redshift range that was selected, with the greatest discrepancies observed for redshifts greater than 1. They note discrepancies of ~25%, which they attribute to use of wide redshift range data rather than the bin-specific approach used in this study. This is because using a wide redshift range does not capture all the changes in how galaxies appear across cosmic time, potentially altering the results of any machine learning algorithm that is applied. For example, the average size of galaxies varies with redshift, however the rate at which this occurs is different for elliptical and spiral galaxies.
Finally, given that the results of this study best align with those of Lee et al. (2024), which applied a similar method to James Webb Space Telescope (JWST) data, the authors suggest that visual inspection introduces bias, regardless of whether it is used directly or to classify a machine learning training set. This is because visual inspection can be subjective, particularly in the case of faint, low-resolution objects at high redshift. It’s possible that in some cases, the same object may be classified differently by two people!
From the study, it is clear that how you study galaxy morphology evolution can have a drastic effect on the results. Based on their analysis, the authors suggest that limiting human visual inspection is important to achieving accurate results. So for now, perhaps we should leave it to experts, which in this case, is apparently AI.
Astrobite edited by Storm Colloms
Featured image credit: NASA, ESA, and the Hubble Heritage Team (STScI/AURA) and Wikimedia Commons