Authors: Thomas Mikal-Evans, David K. Sing, Jiayin Dong, Daniel Foreman-Mackey, Tiffany Kataria, Joanna K. Barstow, Jayesh M. Goyal, Nikole K. Lewis, Joshua D. Lothringer, Nathan J. Mayne, Hannah R. Wakeford, Duncan A. Christie, Zafar Rustamkulov
First Author’s Institution: Max Planck Institute for Astronomy, Heidelberg, Germany
Status: Published in the Astrophysical Journal Letters [open access]
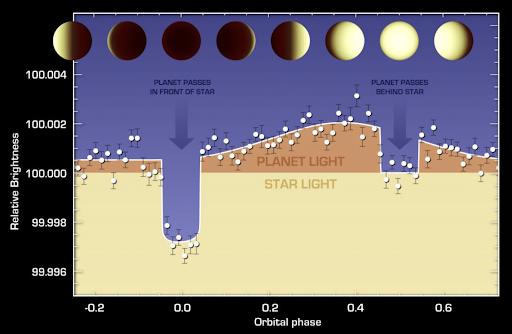
The diverse atmospheres of other worlds continue to stun astronomers. But how do we know if they have clouds made of sand or if they’re raining crystals like the subject of today’s paper: WASP-121b? There are many different ways to study a planet’s atmosphere. One of the most effective methods is measuring the planet’s flux (which is a sum of emission from the planet’s heat and reflected light from the host star off the planet’s atmosphere) over one full orbit around its host star. This type of measurement is called a phase curve. Phase curves can provide us with a wide range of information about atmospheres, and they’re especially important when talking about tidally locked planets. Like our own moon, these planets have one side that always faces the star while the other is constantly shrouded in darkness, effectively a permanent ‘dayside’ and ‘nightside’. Because of this, we can measure each side’s emission at two different points during its orbit. The nightside emission is when the planet transits, or passes in front of the host star; the dayside emission is around the secondary eclipse, where the planet goes behind the host star. These two measurements can be seen in Figure 1, which details the phase curve of another exoplanet taken by the Spitzer Space Telescope. In today’s paper, the authors present the first phase curve measurement taken by JWST’s NIRSpec instrument of the tidally-locked planet: WASP-121b. They use this phase curve to determine where the hottest point on the planet’s surface is, assess how cloudy its nightside could be, and provide better estimates of the temperature on both sides.
A laboratory of chemical creation and destruction
The environment on WASP-121b is unlike anything we have observed in our own Solar System. It’s a type of planet called an ultra-hot Jupiter (often referred to as an UHJ). UHJs are gas giant planets similar to Jupiter (hence the clever name) but with dayside temperatures greater than 2200 K (again, the clever name). Most UHJs can be found closely orbiting the brightest stars in the Universe, making their atmospheres excellent targets for observation (and why WASP-121b was likely chosen for the first JWST phase curve measurement)! With extremely hot daysides, molecules in these planets’ atmospheres will be broken down into their simpler components before being re-circulated by winds to the much cooler nightside, causing them to re-assemble back into molecules. It’s a constant cycle of chemical creation and destruction fueled by the stark temperature contrast. Somebody get these molecules a pair of sunglasses and a winter coat!
Oh JWST, oh JWST, how lovely are thy resolution
With JWST’s higher spectral resolution and lower instrumental errors, we’re able to get tighter constraints on the dayside and nightside properties of WASP-121b. JWST stared at the WASP-121 system for just under 38 hours (since WASP-121b’s full orbit is about 30 hours) in two different wavelength bands of the NIRSpec instrument. The signal received will be a combination of both the star and planet. The authors go on to correct for instrumental errors and extract the planetary signal from the combined star + planet signal in the original data, resulting in the phase curve shown in Figure 2.

One of the stunning things about this phase curve is that you can actually see where the hottest point on the planet is! Take a close look at the secondary eclipses–the U-shaped smaller dips in brightness on both sides of the primary transit. The left side of each dip is higher than the right side, meaning that the planet is brighter before the secondary eclipse than it is afterward. This indicates that the hottest point on the planet has shifted eastward. They find that the hottest point has been shifted 3.36 ± 0.11° and 2.66 ± 0.12° in each wavelength range, respectively. This difference in these shifts between wavelengths can be attributed to the chemistry of WASP-121b’s atmosphere, as different wavelengths explore different layers and thus different chemistry of a planet’s atmosphere.
Cloudy with a chance of crystal rain
While this paper presents the first phase curve taken using JWST, this is not the first phase curve observed of WASP-121b. Previous phase curve observations of the planet by the Hubble Space Telescope found that the low nightside temperature would allow certain elements to condense back together to form molecules. These molecules then form into minerals such as enstatite and forsterite, essentially creating ‘sand-like’ clouds of minerals. We can test this theory by running a general circulation model (GCM) of the planet and comparing it to observations. GCMs take in planetary properties and model what a planet’s atmosphere would look like based upon these properties. All GCMs are numerical models, meaning they solve a system of equations that describe the atmosphere’s motions to get as close to a solution as possible, but never exact. In most cases, including this one, an approximate answer is just as good as an exact one!
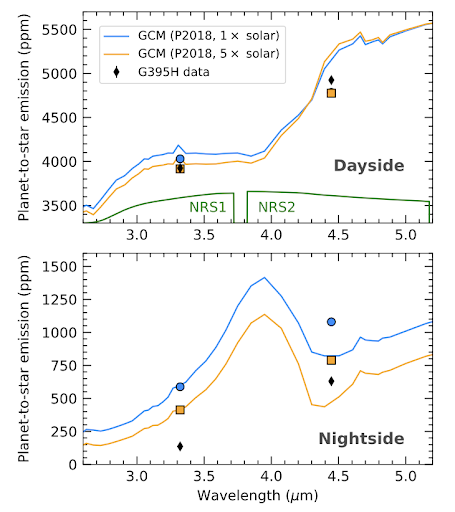
In Figure 3, the authors run two different GCMs for WASP-121b for both the dayside and nightside of the planet. The measured dayside and nightside emission from JWST’s phase curve is shown in the black points in Figure 3. Particularly on the nightside graph, the data points are lower than both of the GCM’s predictions (the blue circle and orange square). This infers that WASP-121b has a lower nightside temperature than predicted by models, indicating a nightside temperature that is cold enough to allow these mineral clouds to form. When it rains on WASP-121b, it pours crystals of rock.
Astrobite edited by Mckenzie Ferrari and Pranav Satheesh
Featured image credit: ESA/Hubble