Title: Revealing a main-sequence star that consumed a planet with JWST
Authors: Ryan M. Lau, Jacob E. Jencson, Colette Salyk, Kishalay De, Ori D. Fox, Matthew J. Hankins, Mansi M. Kasliwal, Charles D. Keyes, Morgan Macleod, Michael E. Ressler, and Sam Rose
First Author’s Institution: NSF NOIRLab, Tucson, Arizona, United States
Status: published in The Astrophysical Journal [open access]
There are many ways a planet can die. One of the most common ways is through planetary engulfment: when a planet collides with and is eaten by its host star. One of the most compelling cases for planetary engulfment is the red nova, ZTF SLRN-2020. A red nova is a type of stellar explosion, different from novae and supernovae. These objects are thought to be the result of two stars merging which then produce a flare that looks red in color. Today’s authors, however, make an interesting claim. After calculating the brightness and duration of the observed explosion, they claim that ZTF SLRN-2020 is not two merging stars, but a star engulfing its planet!
A More Complete Picture
The authors observed ZTF SLRN-2020 with the NIRSPec and MIRI Low-Resolution Spectrometer (LRS) instruments in September 2022, and with the NIRI instrument in August 2022. NIRSPec and MIRI LRS are both spectroscopic instruments, which means they’re capable of looking at light in different wavelengths in a continuous range. NIRI is also capable of looking at light in different wavelengths, but because it’s a camera and not a spectroscopic instrument, it can only look at specific, discrete wavelengths. Red novae emit strongest in the infrared, so these instruments were chosen for their infrared wavelength range. They combined the data from all three instruments, along with previous data taken in April 2022 by the WIRC instrument, to create a spectral energy distribution, or SED, of the red nova. SEDs are the measure of an object’s brightness over different wavelengths. The shape of an SED provides valuable insight as different wavelengths can reveal different information, providing a more complete picture of an object.
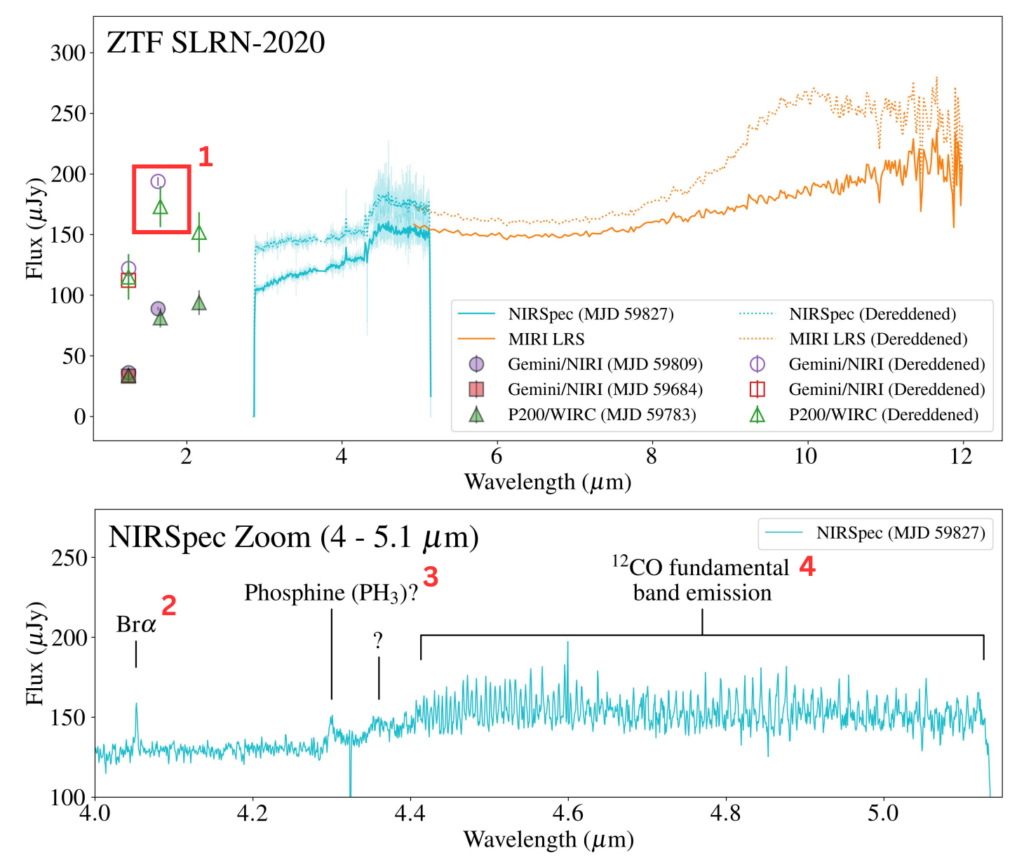
Figure 1 shows the authors’ analysis of the SED of ZTF SLRN-2020. The additional points labelled in red in Figure 1 correspond to the following noteworthy features:
1. This point is the peak of the spectrum. This peak is likely due to the hot, remaining star because dust is too cold to emit so much emission in the near-infrared. That means this part of the spectrum is tracing the photosphere, or outer layer, of the star.
2. The authors detect a Brackett-alpha emission line in the spectrum. This line is the result of electrons losing energy in hydrogen atoms and is common from hot gas. Previous observations of the novae did not find any evidence of hot gas, so this emission represents a new change in the aftermath of the planetary engulfment.
3. The authors suggest this peak in the SED at about 4.3 microns is due to phosphine. Phosphine has been found in the atmospheres of Jupiter and Saturn as well as brown dwarfs. Since this wavelength range is also sensitive to large emission from carbon dioxide, the authors ran a series of simulations to determine if this peak is due to phosphine or carbon dioxide. The simulations showed that phosphine resembled the peak better than carbon dioxide. A remnant from the planet’s atmosphere, perhaps?
4. The series of peaks shown in the bottom panel of Figure 1 are due to the presence of carbon monoxide (or CO). The authors use this detection of CO to rule out scenarios other than planetary engulfment. CO features like these could come from an extremely young star but the spectrum lacks other notable young stellar features. Thus, planetary engulfment is still the best explanation.
From Data to Real Life
After finding these key features in the spectra of ZTF SLRN-2020, the authors do what scientists do best: interpret the data and create a picture of what’s going on…literally! Figure 2 shows the complete picture, given the authors’ interpretation of the data. Let’s break down each component and understand how we got from the squiggly lines in our data to a hungry hungry nova.
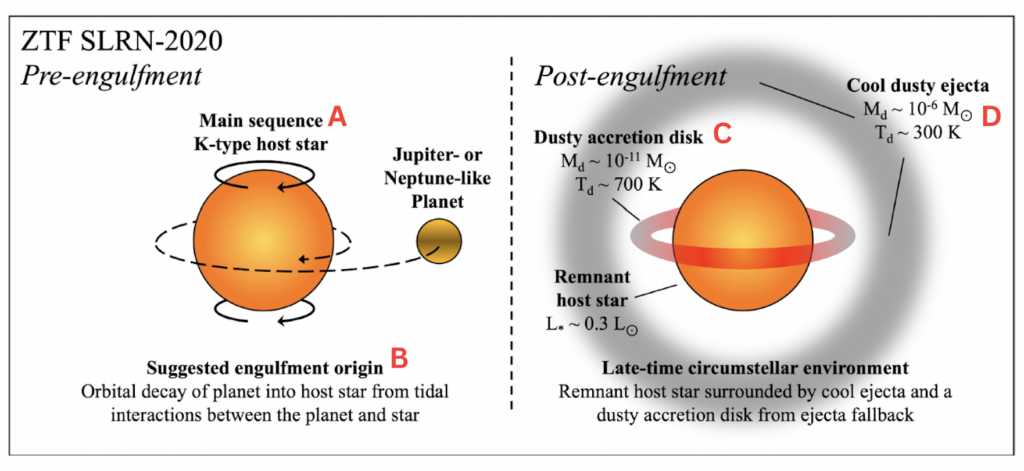
Figure 2 shows the authors’ interpretation of the observations of ZTF SLRN-2020. Each point on Figure 2 is labelled with a red letter which corresponds to the letters in this list:
A. The authors run a series of models that simulate SEDs to understand what kind of star remains and the shape of the dust surrounding the star. They vary the temperature of the star, and find that models with a stellar temperature of ~3500 K and 0.3 times the luminosity of the Sun fit the data best. This indicates that the remaining star is most likely a main sequence K-type star.
B. Because the star is thought to be on the main sequence, the planet could not have been engulfed by the star becoming a red giant, much like how the Earth will be engulfed by the Sun when it becomes a red giant. Instead, the authors suggest that the planet might have experienced decay in its orbit. This would cause the planet’s orbit to get smaller and smaller until eventually it crashed into the star. Given the planet’s large mass (10 times more massive than Jupiter!), it was most likely a hot Jupiter.
C. From the best-fit model of their spectra, the authors estimate the mass and temperature of the dust surrounding the star. This dust was thought to be in a sphere surrounding the star, however…
D. The authors analyze previous data and estimate a different mass and temperature for the dust based upon that previous data! The spectrum shown in Figure 1 was observed about 800 days after the explosion, while the previous data they analyzed was observed only 300 days after the explosion. Given the presence of hot gas indicated by points 2 and 4 in Figure 1, and the different dust temperatures/masses between the two observations, the authors suggest two distinct structures of dust surrounding the star. The first is a hotter, more massive accretion disk surrounding the star (C) that was observed with their data. The second is a cooler, less massive sphere of dust observed from the previous data. This sphere of cooler dust does not show up in the author’s new data because it has already cooled down to a temperature that would emit in longer wavelengths than what was observed.
Today’s paper summarizes the first follow-up observations of ZTF SLRN-2020: the first-ever recorded planetary engulfment. With the combination of near-simultaneous observations between space-based (NIRSPec and MIRI LRS) and ground-based (NIRI) facilities, this study was able to understand the physics behind planetary engulfment to an unprecedented level of detail. While the amount of data is impressive, one should always be cautious of the assumptions that go into modeling such data. Follow-up modeling of the data using different assumptions and tools would strengthen the authors’ argument for tidal decay and the two-part dust structure. Learning how planets die creates a more complete picture of the lives of planets and could help us understand how our own Earth will someday meet its end. Until then, we’ll always have ZTF SLRN-2020.
Astrobite edited by William Smith
Featured image credit: NASA, ESA, CSA, R. Crawford (STScI)