Authors: Katherine Ormerod, Joris Witstok, Renske Smit, Anna de Graaff, Jakob M. Helton, Michael V. Maseda, Irene Shivaei, et al.
First Author’s Institute: Astrophysics Research Institute, Liverpool John Moores University, UK
Status: Preprint on arXiv, Submitted to the Monthly Notices of the Royal Astronomical Society (MNRAS).
Dust is everywhere, not just on your bookshelf, but floating between the stars and quietly rewriting the story we read from starlight. These microscopic grains absorb roughly half of a galaxy’s ultraviolet (UV) and optical photons and re-emit them in the infrared. In some galaxies, especially those with carbon-rich dust, this absorption leaves behind a broad dip in the UV spectrum near 2175 Å , the signature of what’s known as the “UV bump” in the dust attenuation curve, linked to small carbonaceous particles like polycyclic aromatic hydrocarbons (PAHs). Thanks to JWST, we’ve now caught that bump lighting up GNWY‑7379420231, a galaxy barely 700 Myr old and in the middle of a messy merger.
Little did we know, that faint dip would end up challenging everything we thought we knew about how, and when, dust first formed in the Universe.
Why Bother With a Tiny Bump?
Dust might sound like a messy detail, but for astronomers it’s the difference between reading a book in daylight or through smoked glass. If we don’t correct for dust, we undercount star formation, misjudge stellar masses, and blur reionization’s timeline. The Milky Way’s attenuation curve has a smooth rise with a single speed‑bump at 2175 Å. Finding that same feature at high redshift tells us dust grains were already complicated very early on.
Say Hello to GNWY‑7379420231 (z ~7.11)
During JWST’s first year of science operations, its NIRSpec instrument zeroed in on a standout target in the GOODS‑North field: a bright Lyman‑break galaxy. It earns that label because photons with wavelengths shorter than 912 Å ( high‑energy light beyond the hydrogen Lyman limit) are absorbed by clouds of neutral hydrogen, chopping off the blue end of its spectrum. That “break” then shifts into redder filters for more distant (higher‑redshift) galaxies. This galaxy’s redshift was measured to be z = 7.11235 ± 0.00025, so we’re seeing it as it appeared when the Universe was only about five percent of its current age. The catalogue ID GNWY‑7379420231 simply codes its position on the sky.
The high‑quality spectrum allowed the team to sketch the galaxy’s underlying light in two ways:
- Just a tilted line. Astronomers often approximate a galaxy’s UV light with a simple power law, think of it as a straight line on a log‑log plot.
- Tilted line + gentle hump. They then added a broad, bell‑shaped curve (called a Drude profile) to mimic the light that would be absorbed and re-emitted by dust grains.
When the hump was included, the model hugged the data much more tightly. So much so that the improvement reached seven standard deviations. In plain terms, you’d have to repeat the experiment millions of times to get a fit that good by chance. That statistical slam‑dunk confirms the presence of a real dust feature (see Figure 1).
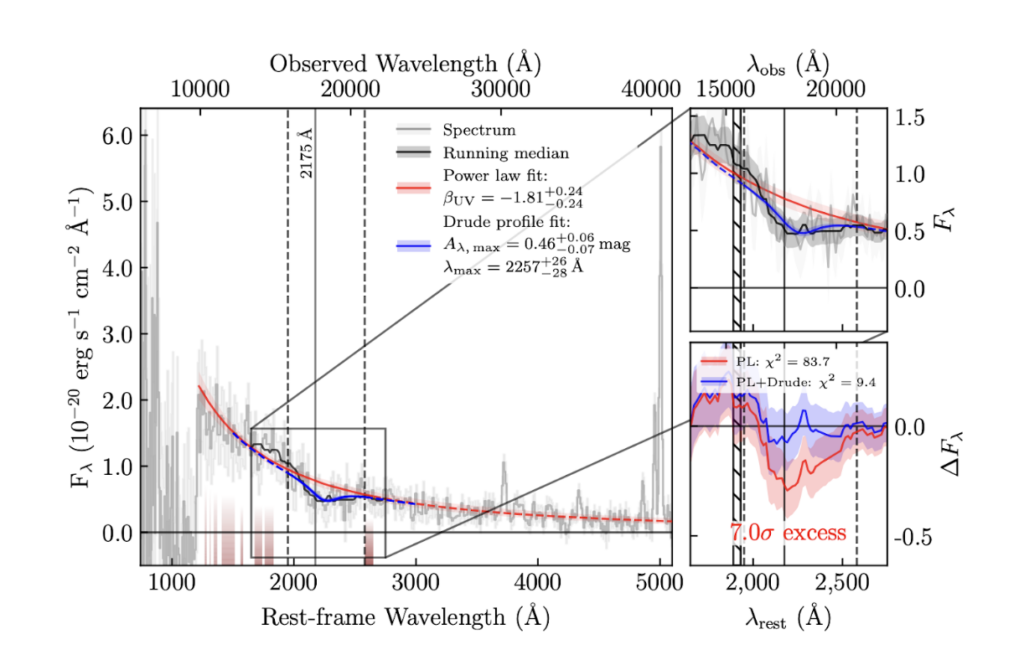
Å UV bump in GNWY-7379420231. The left panel displays the observed galaxy spectrum. The grey one is the data; the red power law fit misses the broad excess at 2175 Å, while the blue power law + Drude model nails it. The upper-right inset zooms in on the UV bump, clearly demonstrating the superior fit provided by the Drude profile. The lower-right panel plots residuals, underscoring the 7 sigma improvement. (Image credit: Figure 2 from today’s paper)A Galaxy Coming Apart
High‑resolution NIRCam images revealed a system with two bright cores surrounded by smaller clumps( classic merger chaos) (See Figure 2). Pixel‑by‑pixel SED fitting backs this up, revealing three stellar populations, a ~250 Myr old component that traces earlier growth, plus two much younger starburst pockets (~56 Myr and ~3 Myr) likely sparked by the ongoing collision.

As Figure 3 makes clear, this collision zone is also where everything peaks: the youngest stars, densest dust, strongest emission lines, and the UV bump itself, all pile up right at the merger interface.
![Eight-panel grid illustrating spatial variations of galaxy properties. Color-coded maps show stellar mass density, star formation rate, UV spectral slope, dust attenuation, stellar age, specific star formation rate, emission line strength ([OIII]+Hβ), and UV bump strength. Bright yellow regions indicate higher values, concentrated at the galaxy’s merger interface.](https://astrobites.org/wp-content/uploads/2025/04/Screenshot-2025-04-20-at-10.43.10 PM-1024x592.png)
Spectral Fireworks
Astronomers can take the “temperature” of star‑forming gas by comparing the brightness of just two oxygen emission lines. In GNWY‑7379420231 those lines are off the charts, the combined [O III]+Hβ glow is about fifty times brighter than the surrounding starlight. Such an over‑powering signal means the galaxy’s newborn stars are blasting their birth clouds with intense ultraviolet light, and a good fraction of those high‑energy photons are slipping straight out of the gas.
Those escaped photons pull a neat double trick: they break large dust grains into tiny shards and make those shards glow, which ramps up the UV bump. Figure 4 shows just how extreme our target galaxy is, sitting separate from the nearby dwarf galaxies nicknamed “Green Peas” and “Blueberries“, small but intense star‑forming systems. A separate shape‑analysis check (using statistics called Gini and M20) leads to the same answer: the galaxy’s starlight is clumpy and off‑center ( classic merger behavior).

Dust‑Making on a Deadline
Ormerod et al. outline a two‑step story for how the bump shows up so early:
First, older AGB stars, about 250 million years into their lives, release carbon-rich dust into the surrounding space.
Then, as two galaxies collide and trigger a burst of star formation, the intense energy from newborn stars, through shocks and turbulence, breaks some of that dust into tiny fragments like PAHs. These small grains are what create the distinctive UV bump at 2175 Å.
Either step alone is plausible; together they light up a bright, shifted bump less than a billion years after the Big Bang.
Why This Matters for Early‑Universe Cosmology
This discovery blows up the old timeline that said complex dust should appear only a few billion years after the Big Bang. Instead, it shows that early galaxies could both build and reshape carbon‑rich grains in a cosmic blink, right inside chaotic mergers like this one.
Those dusty grains matter: they hide starlight, lock up metals, seed new molecules, and even influence how fast the Universe becomes transparent to ultraviolet radiation. JWST will soon tell us whether GNWY‑7379420231 is a rare over‑achiever or just the first example of a common early‑Universe pattern.
Next time you brush a little dust off your desk, remember: somewhere, baby galaxies are colliding, forging those very grains under a sky not yet a billion years old.
Astrobite edited by: Hillary Diane Andales
Featured Image Credit: Niloofar Sharei (Using Canva)