Title: GW190521: tracing imprints of spin-precession on the most massive black hole binary
Authors: Simona J. Miller, Maximiliano Isi, Katerina Chatziioannou, Vijay Varma, Ilya Mandel
First Author’s Institution: Department of Physics, California Institute of Technology, Pasadena, California 91125, USA
Status: Available on arXiv
Every so often, a mysterious, high-profile case lands in the hands of gravitational-wave data analysts. The gravitational wave event GW190521, detected by LIGO in 2019, was one of these remarkable detections. This signal, which holds the record for the most massive black hole binary ever observed, weighed in at a whopping 150 times the mass of the Sun. It marked the first confirmed birth of an intermediate-mass black hole, revealing one way in which these objects can form. But the real intrigue? This signal is a prime suspect of one of the most elusive phenomena to capture in gravitational wave signals: precession.
To understand what precession is, think of a spinning top. As it spins, it also wobbles in a slow circle, and this wobble is precession. In a binary black hole system, a similar effect can happen: the two black holes orbit each other in a flat plane, but if their spins aren’t perfectly aligned with that orbit, the whole orbital plane can start to wobble. Physicists quantify this motion using a parameter called χp, which ranges from 0 (no wobble) to 1 (maximum wobble). The GW190521 discovery paper reports that this system had χp around 0.68, indicating strong evidence for precession.
Case Background
The massive black holes that produced GW190521 spiraled toward each other at very high frequencies at the edge of LIGO’s detection band. Because of this, the signal that physicists could analyze was brief (~0.1 s) and confined to the loudest part, right around the moment the two black holes merged. However, precession typically occurs over longer timescales, and its effects on the merger are not fully understood. So, how could scientists confirm that this system was precessing, given that we only observed a short segment of the signal? This paper examines this brief signal under a magnifying glass, uncovering a tiny detail that enabled astrophysicists to measure precession confidently.
To measure the parameters of a system, including χp, the authors use Bayesian inference. In Bayesian statistics, the prior is the probability distribution that represents the initial beliefs about a parameter, which can be derived from theoretical models or previous observations, before any data is examined. On the other hand, the posterior is the updated probability of a parameter having specific values, considering the data. It reflects both our prior knowledge and the observed evidence. If the prior and posterior are very similar, it suggests the data did not provide much new information.
The Investigation
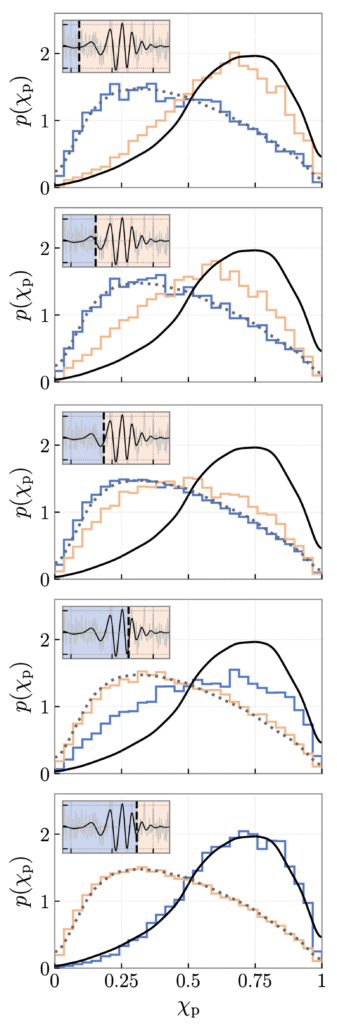
The authors perform Bayesian inference using different segments to understand how distinct parts of the data contribute to the χp posterior. In Figure 1, the top-left inset of each plot shows the complete LIGO data segment (about 0.2 seconds long) in light gray, with the black wave representing the predicted gravitational wave signal within it. A cutoff time divides the data into a pre-cutoff region, shaded blue, and a post-cutoff region, shaded orange.
The outer plots show the posterior distributions for χp obtained using each segment, colored according to their respective segments. The cutoff time shifts to the right as we move down the plots. For comparison, the black dotted line shows the prior distribution for χp, and the solid black line shows the posterior obtained from analyzing the complete data segment.
As the cutoff time moves to the right, the blue distribution shifts from the prior toward the full posterior. In contrast, the orange distribution shifts away from the full posterior back toward the prior. This behavior shows that increasing the amount of data in either segment helps inform the posterior.
Between the first and third panels Figure 1, the orange posterior shifts from consistent with the complete analysis to nearly uninformed, i.e., aligned with the prior. To understand what’s happening here, the authors examine the differences between the complete analysis and the analysis limited to the post-cutoff (orange) data in the third panel.
Figure 2 compares the gravitational wave signal, also called the waveform, predicted by the complete analysis (black) with that of the limited analysis (orange), presenting the 50% credible intervals to account for uncertainty. The data is shown in gray, and dark gray shading indicates the portion of the data excluded from the limited analysis. For the most part, the two waveforms match closely. However, the inset in the figure zooms in on the trough near the merger, where the complete analysis predicts a slightly smaller amplitude than the limited analysis.
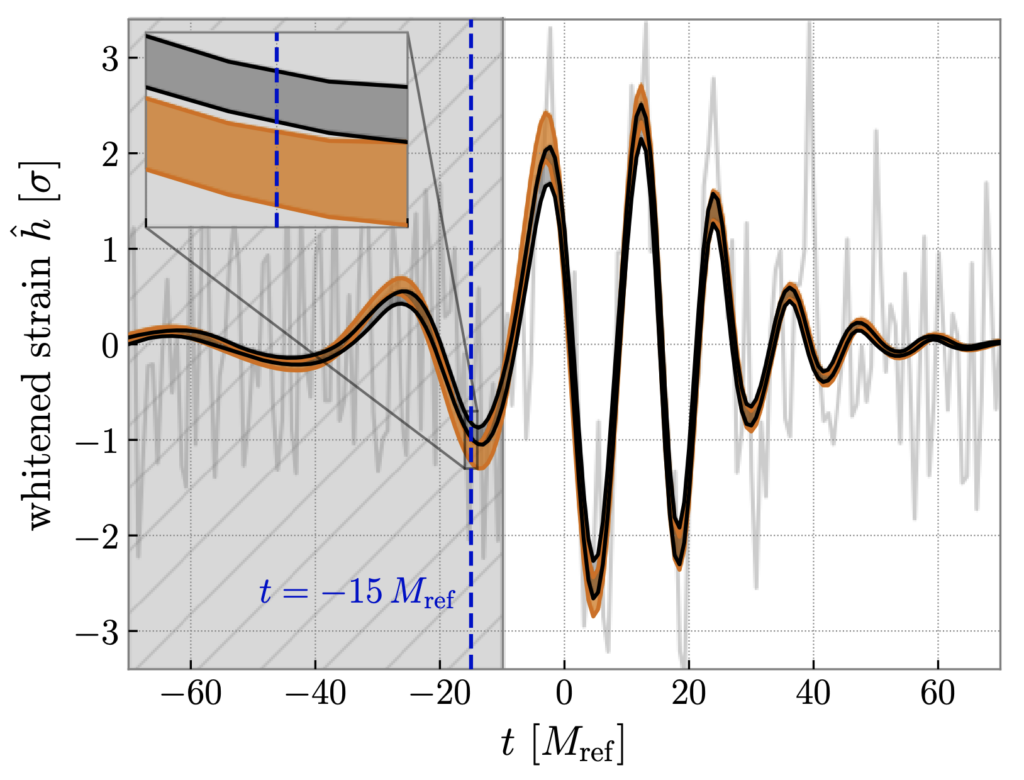
The authors find that this slight difference during the last cycle before the merger provides the key evidence for precession in GW190521. To confirm this, they check how excluding this cycle affects the posteriors for the black hole masses, and find that it specifically informs the precession measurement without significantly changing the mass estimates.
The Verdict
These findings align with our physical intuition regarding precession. As a binary’s orbital plane wobbles, the direction of strongest gravitational wave emission shifts, causing small changes in the amplitude we observe. For GW190521, the difference between confidently detecting precession and having no new information at all came down to this tiny feature in the signal that had to be measured with high precision.
Determining which parts of a signal carry the most information is crucial in knowing whether we’re measuring something real or being misled by noise. By connecting features in the data to specific source properties, we can better judge the quality of our measurements and catch any issues with the models we use. This work highlights not only the subtle imprints that precession leaves on gravitational-wave signals but also the remarkable sensitivity of modern data analysis in detecting these tiny details. Careful detective work like this will enable us to solve even bigger, messier mysteries that are sure to come as the universe sends more of these signals our way.
Astrobite edited by Brandon Pries.
Featured image credit: Deborah Ferguson, Karan Jani, Deirdre Shoemaker, Pablo Laguna, Georgia Tech, MAYA Collaboration