Title: Unveiling the trends between dust attenuation and galaxy
properties at z∼2−12 with JWST
Authors: V. Markov, S. Gallerani, A. Pallottini, M. Brada, S. Carniani, R. Tripodi,, G. Noirot,, F. Di Mascia, E.Parlanti, N. Martis
First Author’s Institute: Faculty of Mathematics and Physics, University of Ljubljana, Slovenia/ Scuola Normale Superiore, Pisa, Italy
Status: Preprint on arXiv.
When light from a distant galaxy reaches our telescopes, it’s already been through a lot. It’s traveled billions of years and, along the way, passed through a haze of cosmic dust—tiny particles within galaxies that absorb and scatter light, reshaping how a galaxy’s spectrum appears to us. For years, astronomers have relied on a few classic templates—like the Calzetti law or the SMC curve—to correct for the light lost to dust. These attenuation curves describe how starlight dims at different wavelengths, and they’re crucial for estimating basic properties like a galaxy’s star-formation rate or stellar mass. But most of these curves were calibrated on local galaxies. What about the first galaxies, forming in the early universe? Would their dust behave the same way? Thanks to near-infrared capabilities of JWST’s NIRSPec and NIRCam instruments, today’s authors set out to find out. In their new study, they used deep spectroscopy and photometry to explore how dust attenuation curves actually behave across 173 galaxies spanning redshifts 2 to 12—a time range that covers nearly 90% of cosmic history. The results are a wake-up call: there is no single, universal dust law. Galaxies don’t just differ in how much dust they have—they differ in how that dust shapes light. The attenuation curve appears to vary from galaxy to galaxy, and those variations appear to track changes in age, dust content, star formation, and metallicity.
Measuring Dust by Letting It Speak
Instead of assuming a fixed shape for each galaxy’s dust curve, the team used the SED-fitting code BAGPIPES to let two key features float freely:
- Slope (S): how quickly the curve rises into the ultraviolet (higher = steeper).
- UV bump strength (B): the prominence of the 2175 Å bump, famously strong in the Milky Way and weak or absent elsewhere.
With this flexible approach, the team didn’t just fit each galaxy’s star light—they captured how its dust behaves, too. And once they had dust curves for all galaxies, they looked for patterns. What kinds of galaxies have steep slopes? Who shows a UV bump? How does that all change with time?
Dust Curves Are Not One-Size-Fits-All
To investigate, the authors grouped galaxies by a range of physical properties—attenuation, star formation rate, stellar mass, age, metallicity, and more. The results, shown in Figure 1, reveal trends: dust attenuation curves vary systematically depending on a galaxy’s internal conditions.
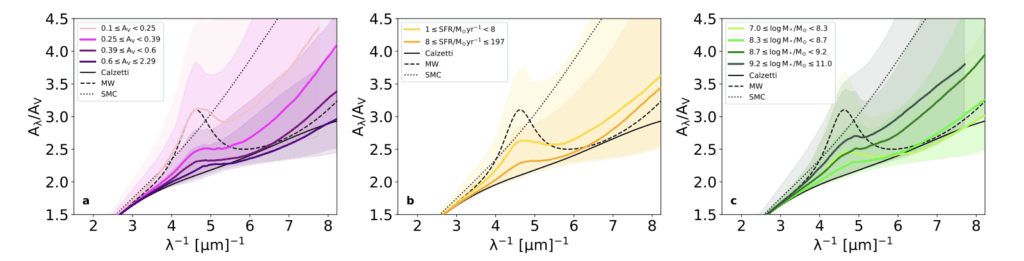
Galaxies with higher V-band attenuation (AV) tend to have shallower curves overall (less steep rise in the UV) and weaker UV bumps—consistent with radiative transfer effects that mute the light from deeply embedded stars. In contrast, galaxies with older stellar populations or higher stellar mass display steeper curves, likely due to the buildup of small, UV-sensitive grains over time. Meanwhile, young, bursty galaxies show flatter slopes, pointing to the destructive power of their intense radiation fields.
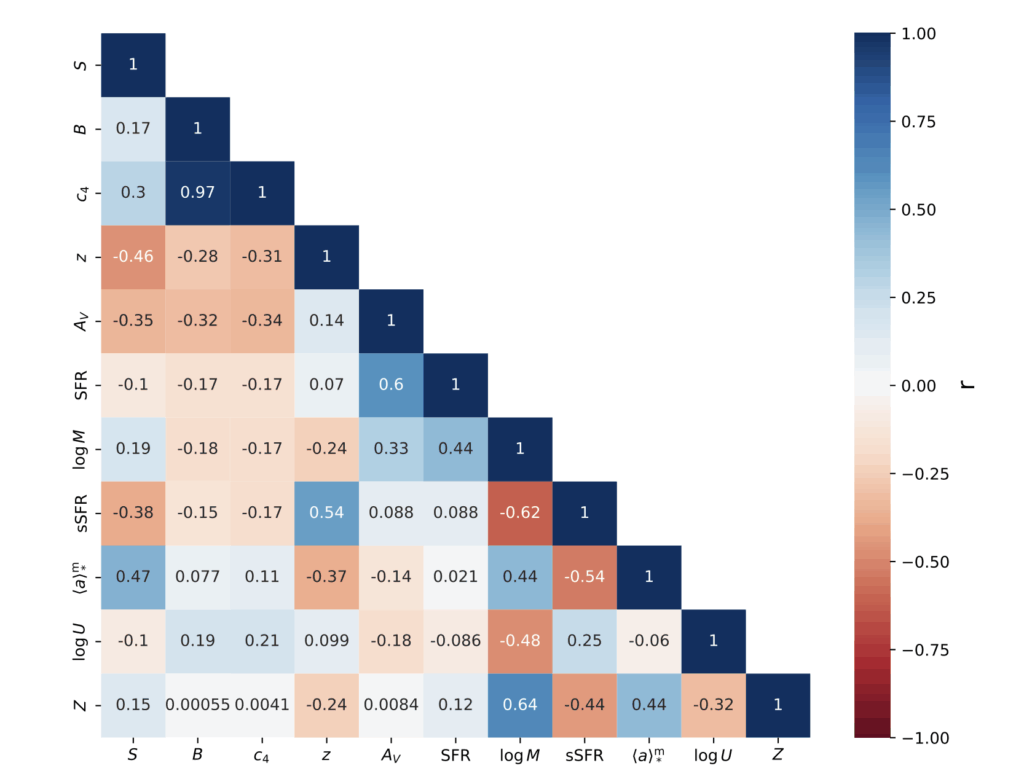
To quantify these relationships, the authors computed Pearson correlation coefficients, as shown in Figure 2. For example the slope anti-correlates with AV (r = –0.35) and specific SFR (r = –0.38), and positively correlates with stellar age (r = 0.47). UV bump strength also drops with increasing AV. While many of these parameters are themselves interconnected, the correlations help show which factors are most strongly tied to the dust curve’s shape.
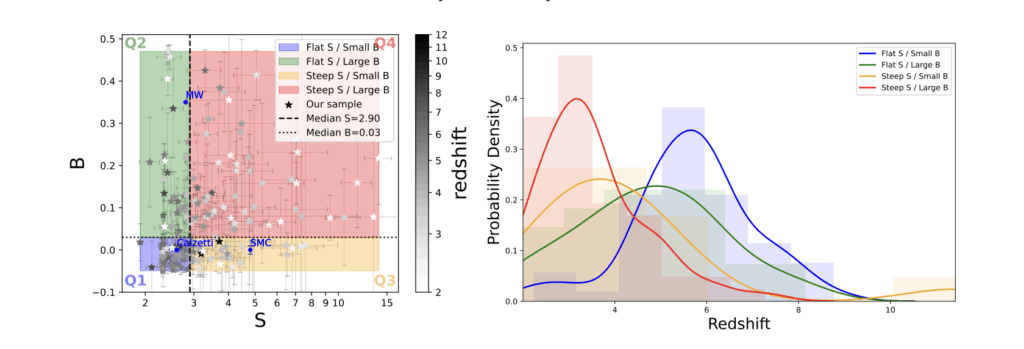
This observational picture gains another dimension in Figure 3. The right panel shows how galaxies are distributed in redshift depending on the shape of their dust curves—specifically the slope (S) and UV bump strength (B). Galaxies with flatter curves and weaker UV bumps (Calzetti-like) tend to dominate at higher redshift, while those with steeper slopes and/or stronger bumps (SMC- or MW-like) are more common at lower redshifts. This trend suggests that attenuation curves themselves may evolve over cosmic time, reflecting changes in how dust is produced, processed, and enriched in galaxies.
What Shapes the Curve?
Having identified these trends, the natural question becomes: what physical processes actually shape the attenuation curve? The authors outline several key mechanisms that may drive the diversity we observe.
One is radiative transfer: In dusty galaxies, UV light is heavily absorbed before it escapes, especially from young, deeply embedded stars. This makes the observed curve appear flatter—not because the grains are different, but because we only see the light that survives.
Geometry matters too. Supernovae and stellar winds can clear out cavities, letting stars shine from relatively dust-free regions. This uneven star–dust mixing can flatten the curve even in dusty galaxies.
Then there’s the grain-level physics. Small dust grains are particularly vulnerable to UV radiation. In high-sSFR galaxies, those intense radiation fields can destroy or modify the smallest grains—the very ones that steepen the UV slope. That’s why galaxies with high specific star-formation rates tend to show the flattest attenuation curves. Older galaxies, on the other hand, tend to accumulate steeper curves over time. This likely reflects the survival and growth of small, UV-sensitive grains as radiation fields weaken.
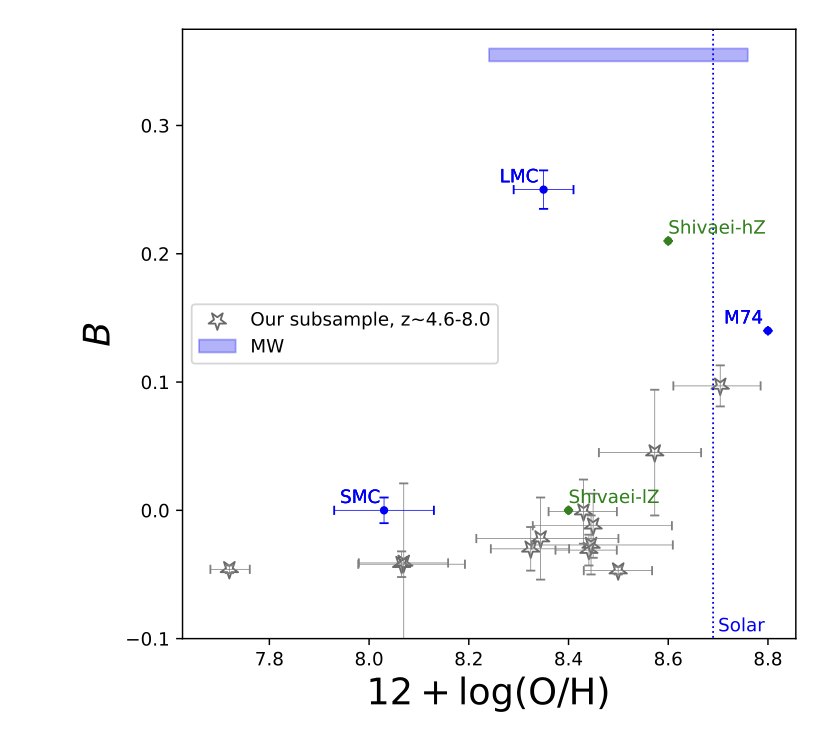
Finally, chemical evolution shapes the dust landscape. Early galaxies likely produced dust primarily through supernovae, which tend to yield larger grains. As galaxies mature, processes like grain shattering and growth begin to populate the ISM with smaller particles and carbon-rich species like PAHs. These small grains both steepen the slope and contribute to the UV bump—especially in metal-rich environments. This connection appears in Figure 4, where galaxies with higher measured oxygen abundances tend to show stronger UV bumps.
Together, these processes describe a kind of dust lifecycle. Galaxies start out with relatively flat, featureless attenuation curves. As they build up metals and process grains through time, the curves steepen and develop structure. But intense star formation can interrupt this process, flattening the curve again—at least temporarily.
A Dust Curve Is a History Book
These results show that attenuation curves are not static assumptions—they’re fingerprints of a galaxy’s physical state. By tracking how the curve shape varies with dust content, age, SFR, and metallicity, we get a window into how dust evolves over cosmic time.
That has big implications. For observers, it means we can’t safely apply a single dust correction to every galaxy, especially at high redshift. For theorists and simulators, it’s a call to reproduce not just how much dust galaxies contain, but how that dust behaves.
Dust doesn’t just obscure the light. It encodes a story—of growth, destruction, enrichment, and time. And with JWST, we’re finally beginning to read it
Astrobite edited by: Ryan White
Featured Image Credit: Niloofar Sharei (Using Canva)