Paper Title: Sun-related variability in the light curves of compact radio sources: A new view on extreme scattering events
Authors: Nicola Marchili, Gunther Witzel, and Margo Aller
First Author Institution: INAF-Istituto di Radioastronomia
Status: Published in Astronomy & Astrophysics (open source)
My radio telescope insists he’s totally fine to do science – it’s just a bit of twinkling, really!
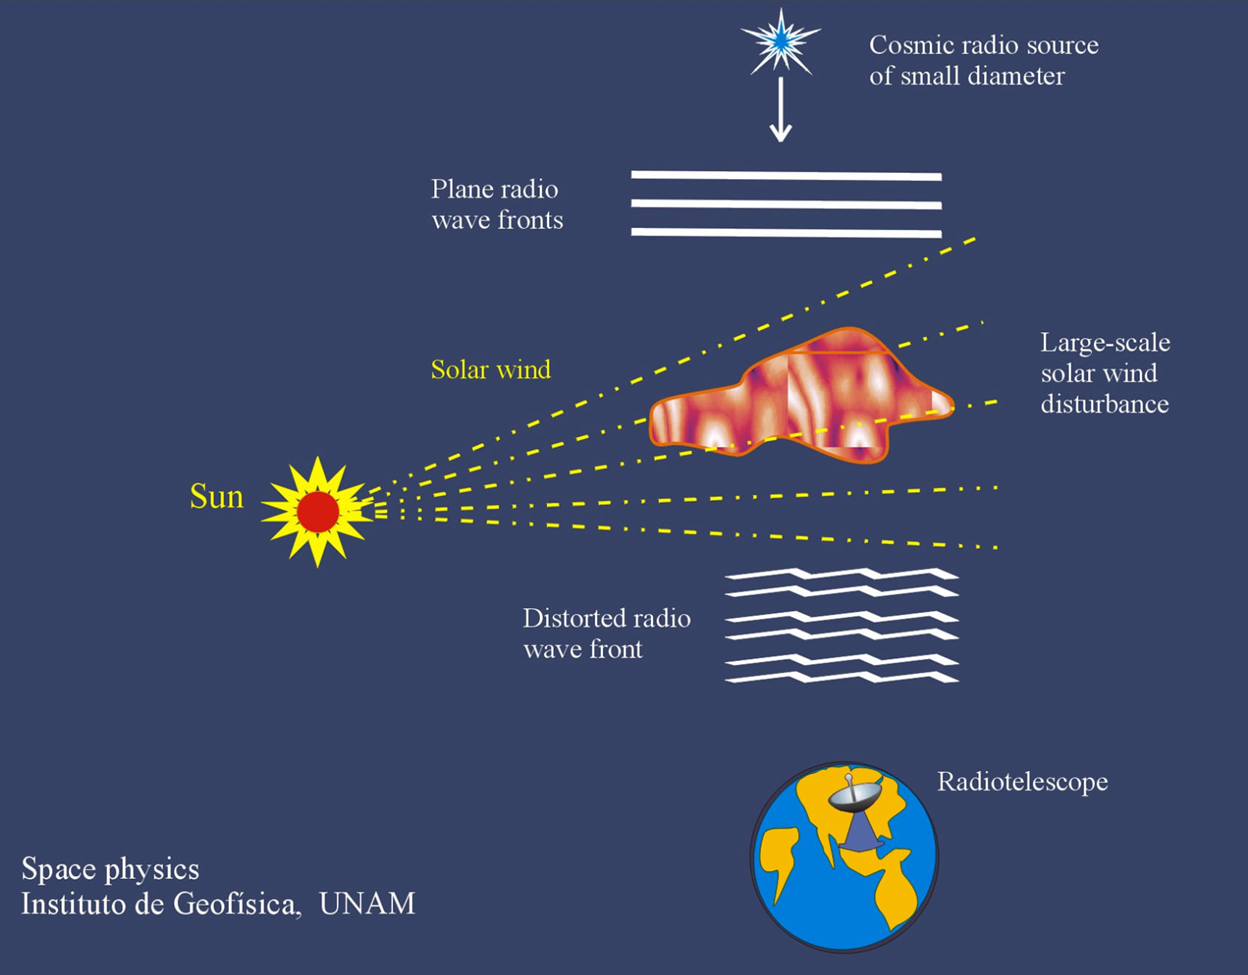
Radio telescopes reveal the activities of some of the most extreme astrophysical phenomena, including supernovae, pulsars, gamma-ray bursts, tidal disruption events, and black hole fueled jets in active galactic nuclei (AGN). This is because nearly all cosmic radio emission is powered by strong magnetic fields and highly energetic relativistic particles (unless the source is very cold – we’re talking single digits Kelvin – dust or gas), both of which are difficult to generate. Modern astronomical surveys on radio telescopes such as ASKAP, MeerKAT, and the VLA have ushered in an exciting new era, and we are now able to watch these objects evolve in real time! However, there is one major hurdle: radio sources twinkle! Most of us have seen the stars twinkle in the night sky, which is due to Earth’s atmosphere jostling their light around en route to our eyes; similarly, the plasma that is ubiquitous in space distorts radio light, a process known as scintillation. Generally, the twinkling of radio sources is attributed to the interstellar medium (interstellar scintillation, or ISS), which maxes out around a 30% fluctuation in brightness. Rarely, we will observe an extreme scattering event (ESE), an especially dramatic manifestation of ISS. In a radio source with variable brightness, distinguishing between scintillation and fluctuations caused by the source itself is challenging, particularly if the source is transitory (such as a supernova or tidal disruption event) or just mischievous (like blazars, a special type of AGN famous for extreme oscillations in brightness). Carelessly dismissing changes in brightness as ISS can cause us to miss out on interesting new physics, and mistakenly attributing fluctuations from ISS to the source itself can lead to superfluous results. If this doesn’t sound daunting enough already, today’s authors argue that there is yet another complication, which is often overlooked – twinkling caused by our very own Sun!
Sussing out the Sun
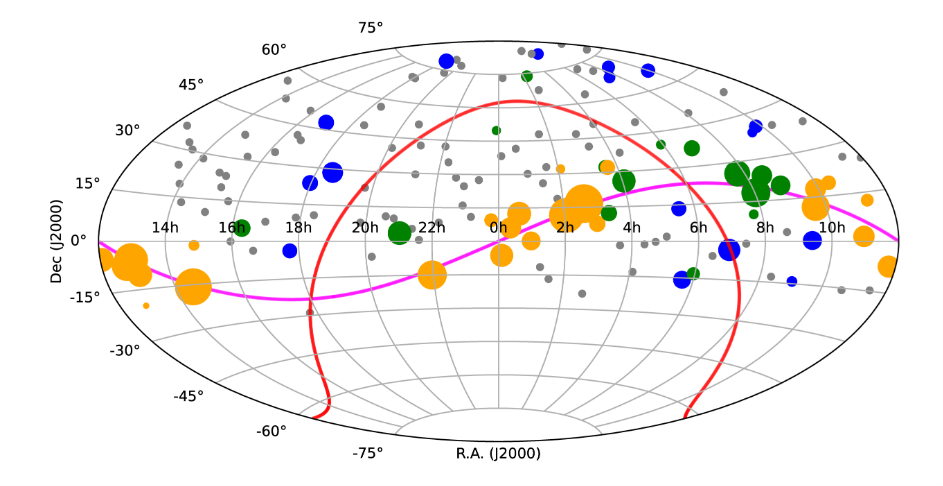
Today’s authors decide to search for repeating ESE-like fluctuations in radio sources with cycles correlated with the position of the Sun. Luckily, the perfect dataset for doing so has been around for decades. Between 1979 and 1996, the U.S. Navy regularly monitored 149 extragalactic radio objects (AGN) with the goal of finding and studying ESEs, and they were successful! Our authors, too, are successful, and identify four different Sun-related patterns.
Icarus AGN: They flew too close to the Sun
The first pattern, which is also the easiest to explain, occurs in AGN located along the ecliptic, or the Sun’s path across the sky. Once a year, as the Sun appears to approach (or even cover) an AGN, the AGN exhibits a flurry of quick oscillations, which our authors name Sun-related variability (SRV) Type I. Unlike Icarus, whose wings really did melt off when he neared the Sun, the AGN aren’t actually changing; the Sun has just crept into the telescope’s field of view and messed up all the measurements!
Labyrinth of Crete AGN (confusing!!!)
The remaining three patterns are much more mysterious, including two more forms of SRV: Type IIa and Type IIb. Sources showing SRV Type IIa feature annual ESE-shaped drops in brightness, occuring when they are closest to the Sun, and, as with SRV Type I, these sources mostly lie near the ecliptic. On the other hand, SRV Type IIb show similar periodic decreases in brightness, but twice as often, and only ever in January and July. Even more interesting, the sources with SRV Type IIb appear along a ring in the sky, and the events occur both when they are closest to the Sun, and when they are the furthest. For both SRV Type II, the event durations vary, and sometimes are skipped entirely! While the correlation with the Sun is clear, the underlying physics is not.
New addition to the Extragalactic Olympics – synchronized extreme scattering events?
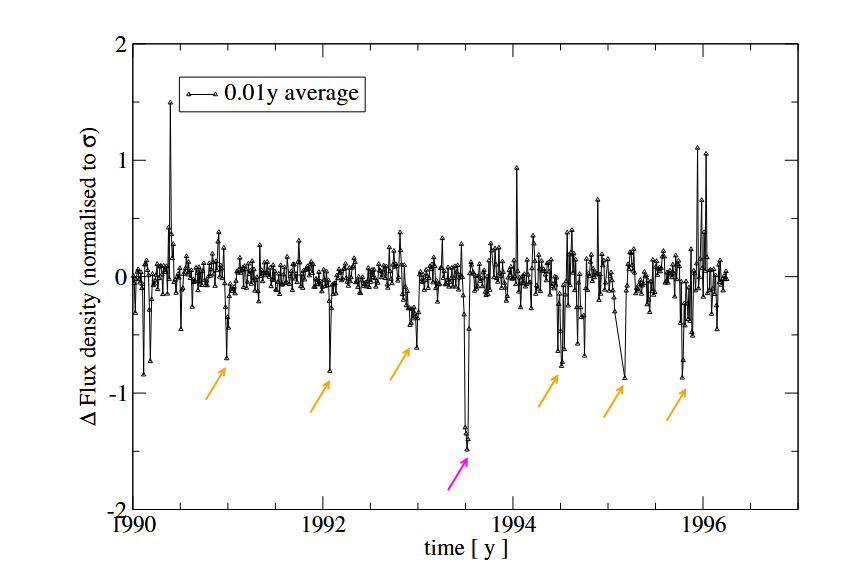
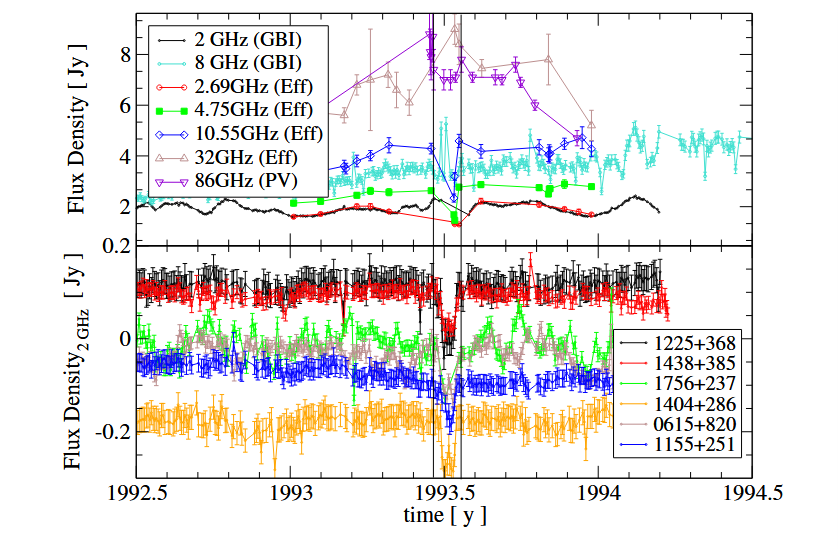
The last, and perhaps most perplexing, pattern is the time-dependent variability (TDV). In 1993, an ESE was spotted in one of the blazars by the original investigors; in 2025, our authors find the exact same ESE occuring at the exact same time in at least 8 other sources – spread all over the sky, with random apparent distances to the Sun! Stranger yet, the ESEs repeat in all the sources, sometimes even for 3-4 years! Concerned that they had uncovered a new issue with the original telescope, our authors check archival observations from other telescopes, which confirm the synchronized ESEs.
Investigations begin
So, what on Earth (or rather, what on Earth’s orbital plane) is going on?? Since ESEs are typically assumed to originate in the interstellar medium, our authors investigate the possibility of ISS first. Unfortunately, ISS certainly cannot explain TDV, since the affected sources (all extragalactic) are billions of light years apart; we would need an exceptionally massive and homogeneous sheet of plasma to cause all the simultaneous ESEs. A stationary blob of plasma blocking our view in January could explain SRV Type IIb, with repeating ESEs every time the blob re-crosses our line of sight (every January and July). However, this theory is inconsistent with the yearly cadence of SRV Type IIa and the occasional skipped events in SRV Type IIb, and the strong relationship to the Sun would have to be entirely coincidental. Moreover, sources affected by either SRV in the same region of the sky have event cycles which are slightly offset from one another in time, and this offset is equal to the time delays between their closest approaches to the Sun, which suggests the offending plasma sheet is much closer to home.
Next, our authors consider instrumental origins. Since the affected AGN are widely spread across the sky, calibration errors are unlikely, and the multi-telescope confirmation of TDV effectively rules out an instrumental cause. While the events in SRV Type I are very regular, as expected for systematic effects, those in Type II are not. Alternatively, maybe the Earth’s orbital motion could play a role. After all, SRV Type II events occur in January and July, which just so happens to correspond with perihelion (the time of year when Earth is closest to the Sun) and aphelion (the time of the year when it is furthest from the Sun). However, Earth’s distance from the Sun varies too smoothly and too little to manifest in such dramatic distortions. In any case, we would see events at both perihelion and aphelion (inconsistent with Type IIa) and the effects would be strongest for sources near the ecliptic (inconsistent with Type IIb). Earth’s atmosphere also can’t be the cause, since it can’t scatter radio light this much. Storms or other meteorological events are localized (so how could TDV be confirmed by faraway telescopes?) and temporary (so how could they cause repeated episodes?). Reflection from the Sun doesn’t cut it either, since the pattern carries on day and night.
Conclusions-Beware the Sun!
Fortunately, there is one promising solution to this scintillation puzzle: the Earth’s magnetosphere! Its structure in any given direction depends on the position of the Sun, and its shape varies throughout the year, with the solar wind driving the greatest changes in January and July. Our authors conclude that stronger fluctuations in the magnetosphere structure contribute to TDV, while weaker fluctuations will only affect sources nearest to the Sun in January or July (giving us SRV Type II!). Additionally, in most of the sources, we are seeing the superposition of multiple effects, including scintillation due to nearby plasma (in the Solar System or even Earth’s ionosphere), which is why there is no obvious self-consistent explanation. Regardless, ESEs are likely even rarer than previously thought, and when studying radio-variable phenomena, we must be careful to account for the twinkling our Sun is causing!
So, my radio telescope is probably right that he’s safe to do science, as long as he is careful with his Sun-blurred vision, which is just as well – I don’t know if we’d be able to find an Uber big enough to send him home in!
Edited by William Smith. Featured image is Figure 1 in Gonzalez-Esparza et al. (2002).