Title: Dark Exoplanets
Authors: Yang Bai, Sida Lu, and Nicholas Orlofsky
First Author’s Institution: University of Wisconsin-Madison, Madison, Wisconsin, USA
Status: published in The Physical Review D [closed access]
One of the greatest unsolved questions in astronomy and physics is the nature of dark matter (see other bites on this topic here). Dark matter makes up nearly 85% of the total mass in the Universe and is only really seen through its interactions with gravity. While there are theories on what this type of matter is made up of, one possibility is that it’s made up of particles that are made up of smaller particles. Just like how regular matter is made up of atoms that are formed by protons, electrons and neutrons, dark matter could have a similar composition! If dark matter is indeed made up of particles that are combinations of other particles, its masses and radii could grow as big as planets. In today’s paper, the authors discuss the possibility of these ‘dark exoplanets’ and how we could distinguish them from planets made of ordinary matter.
Planet Hunters Inc.
There are several ways to find and characterize an exoplanet. The authors explore some of these techniques and offer ways in which they could help distinguish between a dark exoplanet or an ordinary exoplanet:
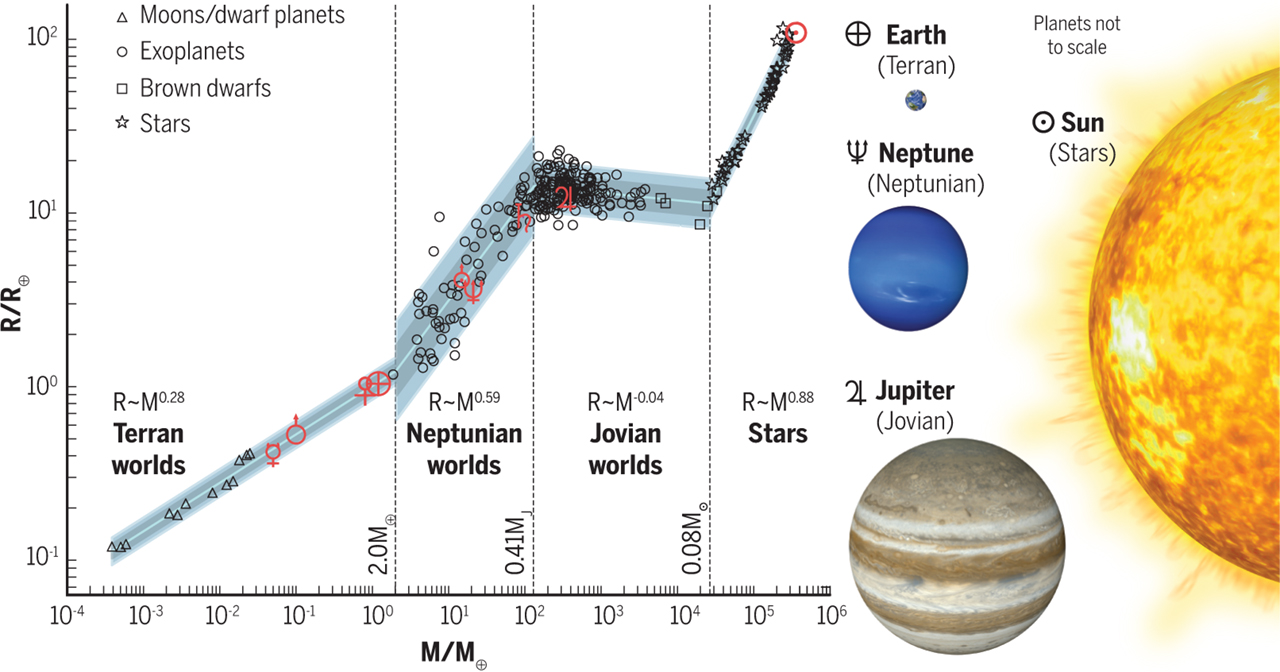
- Mass-radius relationship: Different types of exoplanets (i.e. rocky, gaseous, etc.) have different mass-radius relationships. This means if you plotted a specific category of planets’ masses on the x-axis and their corresponding radii on the y-axis, you would see a line with a specific slope. These specific slopes change for each category of exoplanet that you look at, but most planets of ordinary matter would fall near or on those lines. A planet made of dark matter however, might not follow this relationship, despite having the mass and radius to do so. See Figure 1 for more detail.
- Spectroscopy: Transmission spectroscopy is a great way to see what molecules or elements are in an exoplanet’s atmosphere, by looking for their spectroscopic signatures as a planet transits a star. (You can find a bite on this here.) We could potentially find a dark exoplanet by taking transmission spectra and seeing if it matches any type of ordinary exoplanet. If not, the weird behavior could be an indicator of a dark exoplanet!
- Transits: Transits occur when exoplanets pass in front of their host stars, causing a dip in the star’s brightness. Since most exoplanets that we see today were discovered through the transit method, the authors focus today’s paper on the possibility of finding a dark exoplanet via transits.
Follow the Dips
Dark matter can be detected easiest by measuring its effects on gravity. Its effects on light, if any, are not as easily detected. For this reason, the authors assume dark exoplanets have a smaller effect on transit lightcurves. This means the planets would be semi-transparent, producing a smaller dip in their host star’s brightness and models would need to take optical depth into account when fitting data. Just as a refresher, optical depth measures how opaque something is. The authors build a transit model for ordinary exoplanets, assuming an opaque sphere, and build a separate one for dark exoplanets, assuming a semi-transparent sphere that’s described by optical depth. They first fit both of these models to the exoplanet K2-44b. This can be seen in the top panel of Figure 2, where the green and red lines correspond to the ordinary exoplanet and dark exoplanet model, respectively.
As expected, the two models overlap perfectly, meaning either one could be used to describe the transit data. However, just because the dark exoplanet model doesn’t fit the data any better than the ordinary exoplanet model, doesn’t mean it shouldn’t be considered. In the top panel in Figure 2, the blue dotted curve is an example of a bad fit to the data. This blue curve is represented by the blue dot in the bottom panel of Figure 2. The bottom panel of Figure 2 plots the relationship between optical depth and planet radius in the dark exoplanet model, while keeping all other parameters constant to their best-fit values. The yellow shaded region represents the 68% confidence level of the best-fit dark exoplanet model with the green shaded region representing the 99% confidence level of the best-fit dark exoplanet model. As the shaded regions approach a smaller planet radius, they become wider and as they approach a larger planet radius, they become narrower. This means that as we go to smaller and smaller planet radii, our ability to distinguish between the ordinary and dark exoplanet models is worse and the probability of a bad fit explaining the data becomes more likely.

To understand if a dark exoplanet light curve can always be fit by an ordinary exoplanet light curve, the authors simulate fake dark exoplanet light curves and fit both dark and ordinary exoplanet models to the data. They generate 1,280 light curves using mass-radius relationships and parameters consistent with TESS and Kepler data sets. They take a conservative approach by saying that if the ordinary exoplanet model fits the data well, they do not consider it a dark exoplanet candidate, even if the dark exoplanet model improves the fit.They find that, out of over 1000 light curves, 120 of them are classified as undetectable, meaning the ordinary exoplanet model does not fit their light curve well. They find again that the most important parameters in distinguishing ordinary exoplanets from dark exoplanets is the optical depth and planet radius. In Figure 3, the top panel shows the dark exoplanet candidates in red and blue diamonds and the ordinary exoplanets in gray. The best way to distinguish dark exoplanet candidates from ordinary exoplanets is if the dark exoplanets are larger in radius and more transparent. This is why the dark exoplanet candidates are clustered around high planetary radii and lower optical depths.

Some light curves were indistinguishable between ordinary and dark exoplanet models. These points are shown in green in Figure 3. All of these planets had inclinations close to the minima of their semi-major axis parameters, meaning these planets just barely transited around the edges of their host stars. You can see this in the bottom panel of Figure 3, where most of the green dots follow the curve. This is because at the outer edges of host stars, limb darkening effects matter much more than if the planet was transiting across the center. Limb darkening is a physical effect where the center of the star appears brighter than the outer edges. Since the star is fainter on its outer edges, the model is unable to distinguish between the limb darkening effects and the transparency effects of the dark exoplanet. This means, in order to truly see a dark exoplanet and confirm it, it must transit through more than the edges of the host star, have a large radius, and be relatively transparent.
Today’s paper summarizes the thought-provoking idea of dark exoplanets, planet-sized masses of dark matter. While the authors extensively went through the process of trying to find a dark exoplanet via the transit method, they do make several assumptions in their calculations. They assume the planet is in a circular orbit and in a one-planet, one-star system. They also do not consider secondary eclipse measurements (when the planet goes behind the star) nor do they consider planetary rings, moons, starspots, stellar rotation, and other effects. The authors do acknowledge that these effects could impact the detection of transparent planets, confusing these phenomena with dark exoplanets in a full data analysis. However, these types of planets would have the same possibility of being captured as an ordinary exoplanet. And if stars are typically born in regions with a high dark matter density, then they could even be formed at the same time as ordinary planets in a system. If everyone has a dark side…that means exoplanets do too.
Astrobite edited by Hillary Diane Andales
Featured image credit: NASA/JPL-Caltech/R. Hurt (Caltech-IPAC)