Title Probing Magnetic Field Morphology in Galaxy Clusters with the Gradient Technique
Authors: Yue Hu, Alex Lazarian, Yuan Li, Irina Zhuravleva, Marie-Lou Gendron-Marsolais
First Author’s Institution: Department of Physics & Department of Astronomy, University of Wisconsin-Madison, Madison, WI 53706, USA
Status: Published in AAS Journals [open access]
Galaxy clusters‘ main baryonic component is the intracluster medium (ICM). The ICM is a very diffuse, weakly magnetized plasma. While these weak magnetic fields don’t cause direct impacts on the large scale of the cluster, they can change very small scale plasma properties. These small scale changes can then suppress large scale plasma instabilities like the Kelvin-Helmholtz Instability, gas mixing, or transport processes that move cosmic rays and other particles.
Measurements of the properties of the ICM are difficult to make because it is so magnetically weak and diffuse. Along the line of sight, magnetic fields are only a few microGauss (uG), which causes the Faraday Rotation and Zeeman Splitting effects to be very weak. In the plane of the sky, magnetic fields can be estimated based on the X-ray and radio emission from synchrotron radiation. This method can be difficult to use as we expect the ICM to be turbulent based on X-ray data from the Hitomi mission, causing the magnetic fields to be scrambled.
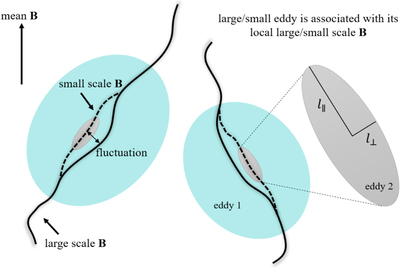
In today’s paper, the authors describe the method that they have developed, called the Gradient Technique (GT), which uses X-ray and radio emission intensity maps to learn about the plane-of-sky magnetic fields in the ICM. This technique works because magnetic turbulence is expected to be anisotropic and the ICM is known to be magnetic and turbulent. The turbulent “eddies” are elongated along (parallel to) the local magnetic fields, which causes the density and velocity gradients of the emission to be perpendicular to the magnetic fields (see Fig. 1). To generate magnetic field maps in the plane of the sky, the emission map is convolved to produce maps of the gradients, which are then binned for subregions of the image. The peak of each binned subregion is then taken as the magnetic field value.
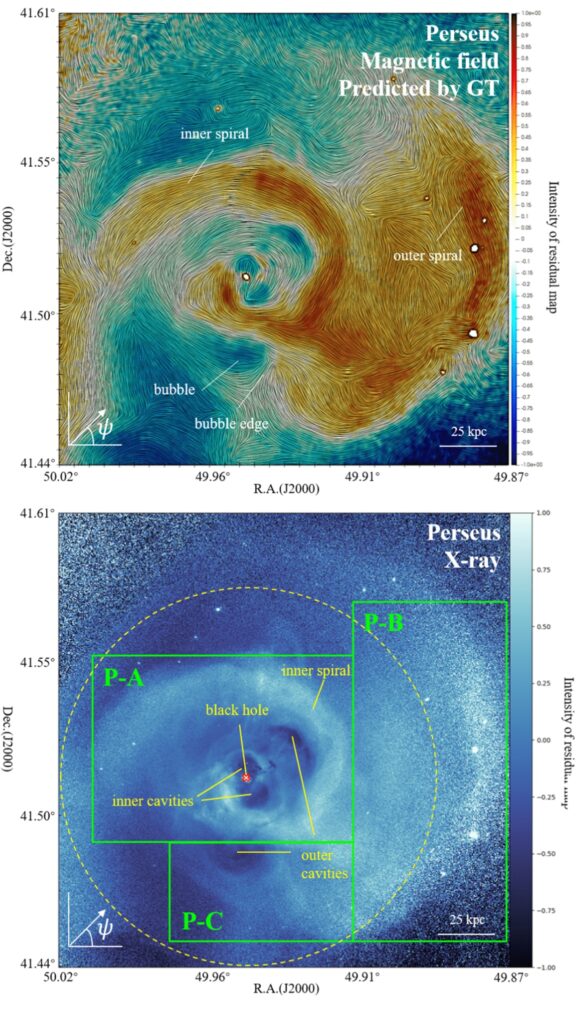
The authors apply this technique to several very bright local galaxy clusters to predict their plane-of-sky magnetic fields. Their maps for the Perseus cluster found that the fields follow the sloshing ‘arms’ of the cluster, which agrees with simulations. For the Perseus cluster, they were also able to use both X-ray and radio data, and they found that their predicted magnetic fields agreed with the two datasets (see Figure 2).
Galaxy clusters are often divided into cool-core clusters and non-cool-core clusters, defined by the ICM temperature dropping off at the center of the cluster, likely due to radiative cooling of the gas. For the cool-core clusters Perseus, M87, and Abell 2597, they found that the mean magnetic fields were oriented tangentially to the cores, not radially outward. This deviated in the non-cool-core Coma cluster, where the cluster is merging and the core is isothermal. In the Coma cluster, there is no preferred direction for the magnetic field, but at larger radii, the mean magnetic fields are radially oriented. This could be related to the fact that the cluster is merging, and the fields are due to infalling material.
Finally, the GT predicted fields show evidence for magnetic ‘draping’. Magnetic draping is an effect where a thin, tangential magnetic field falls along a discontinuity in the plasma. For example, if an active galactic nucleus (AGN) jet blows a large, low-density bubble into the ICM, the magnetic field may drape over the boundary of the two regions. In the GT maps, draping is observed at the edges of the jet bubbles in the cool-core clusters. In the Coma cluster, there is evidence for magnetic draping around some of the constituent galaxies.
The Gradient Technique represents new ways of finding plane of sky magnetic fields, unlocking new physics in clusters. Further observations are needed to confirm the accuracy of these results and to identify sources of error and bias in the method.
Astrobite edited by Neev Shah
Featured image credit: this paper, Figure 3