Authors: Visal Sok, Adam Muzzin, Vivian Yun Yan Tan, Yoshihisa Asada, Maruša Bradač, Vince Estrada-Carpenter, Kartheik G. Iyer, et al.
First Author’s Institute: Department of Physics and Astronomy, York University, Canada.
Status: Preprint on arXiv.
If you look far enough back in time, galaxies often look lumpy rather than smooth. Instead of familiar spirals or ellipses, you see many bright knots across galaxies. Those knots are star-forming clumps, compact regions a few thousand light-years wide lit by fresh stellar populations.
Clumpy galaxies are common. In Hubble images of the early universe, astronomers could see that many galaxies around redshift two, a time known as cosmic noon when star formation reached its peak, were dotted with kiloparsec-scale knots of light. Some of these clumps hold as much as a billion solar masses in stars. Two main ideas have been put forth explaining the origins of these clumps. One suggests that clumps form within a galaxy itself when its gas-rich disk becomes unstable and fragments, a process called violent disk instability (VDI). The other argues that at least some clumps are small satellite galaxies that have been pulled in and disrupted. Both likely play a role, and the challenge has been figuring out how much each contributes
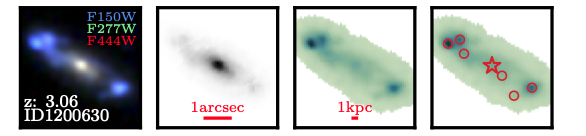
Using data from Canadian NIRISS Unbiased Cluster Survey (CANUCS), the team measured the masses and ages of more than twenty thousand clumps in nearly 4500 galaxies spanning redshifts 0.5 < z < 5. This large sample lets the team follow how clumps form, grow, and eventually fade as their host galaxies evolve. CANUCS targets five massive lensing clusters and their surrounding “flanking” fields with both the NIRCam and NIRISS instruments, combining James Webb Space Telescope (JWST) ’s resolution with the legacy of Hubble imaging. The resulting data are able to reveal clumps smaller than a kiloparsec, even in galaxies billions of light-years away.
Finding the Clumps
To identify clumps, the authors mapped stellar mass and ultraviolet light across each galaxy using JWST images. They then searched for compact UV peaks that stood out from the surrounding disk. To ensure these detections were real and not noise, they injected fake clumps into the data and confirmed that their method correctly recovered most clumps above ~10⁸ M☉ (where M☉ means one solar mass).
How Common Are Clumpy Galaxies?
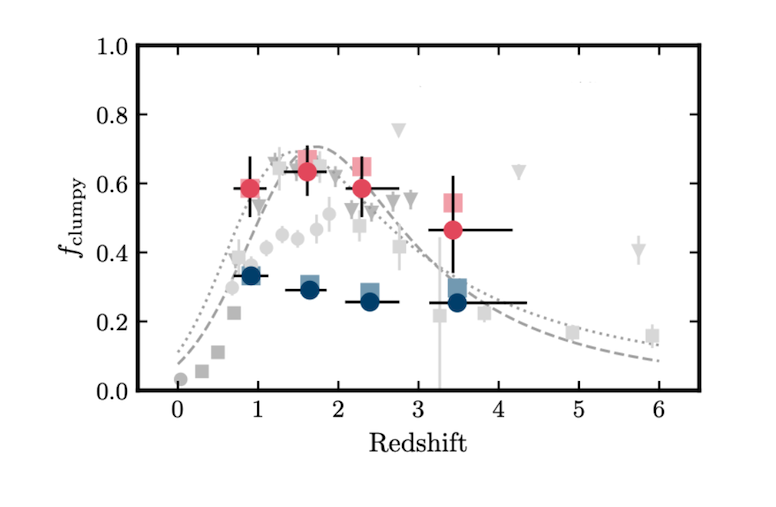
If you look at Figure 2, which shows how the clumpy fraction changes over cosmic time, one trend stands out clearly. In the early universe, around redshift ~4, roughly forty percent of massive galaxies (those heavier than about ten billion M☉) contained at least one bright clump. That fraction rises to nearly sixty percent by redshift ~2, when star formation activity across the universe was at its peak. After that, toward lower redshift, galaxies become more settled and the clumpy fraction declines again.
Smaller galaxies tell a quieter story. Systems with masses between 10⁸·⁵ and 10¹⁰ M☉sit near a thirty-percent clumpy fraction across the entire redshift range. The authors note that this value might be slightly underestimated, since clumps in low-mass galaxies are harder to detect and some are likely missed even after applying completeness corrections. In other words, the biggest galaxies were the messiest at cosmic noon, while the smaller ones maintained a steady but milder level of irregularity. This supports the idea that gas-rich disks (especially in massive galaxies around z ≈ 2 ) are prone to fragmentation, triggering bursts of star formation that make galaxies look patchy.
The Clump Mass Function
The team also measured the clump stellar mass function (cSMF), which counts how many clumps exist at each mass. In nearby galaxies, the masses of star clusters and molecular clouds tend to follow a power law with a slope around minus two, meaning small clumps are common while massive ones are rare.
Across the full sample, the same pattern appears: the cSMF slope stays close to –2 from redshift five all the way to the nearby universe. That consistency hints that the basic physics of clump formation hasn’t changed much over the past ten billion years.
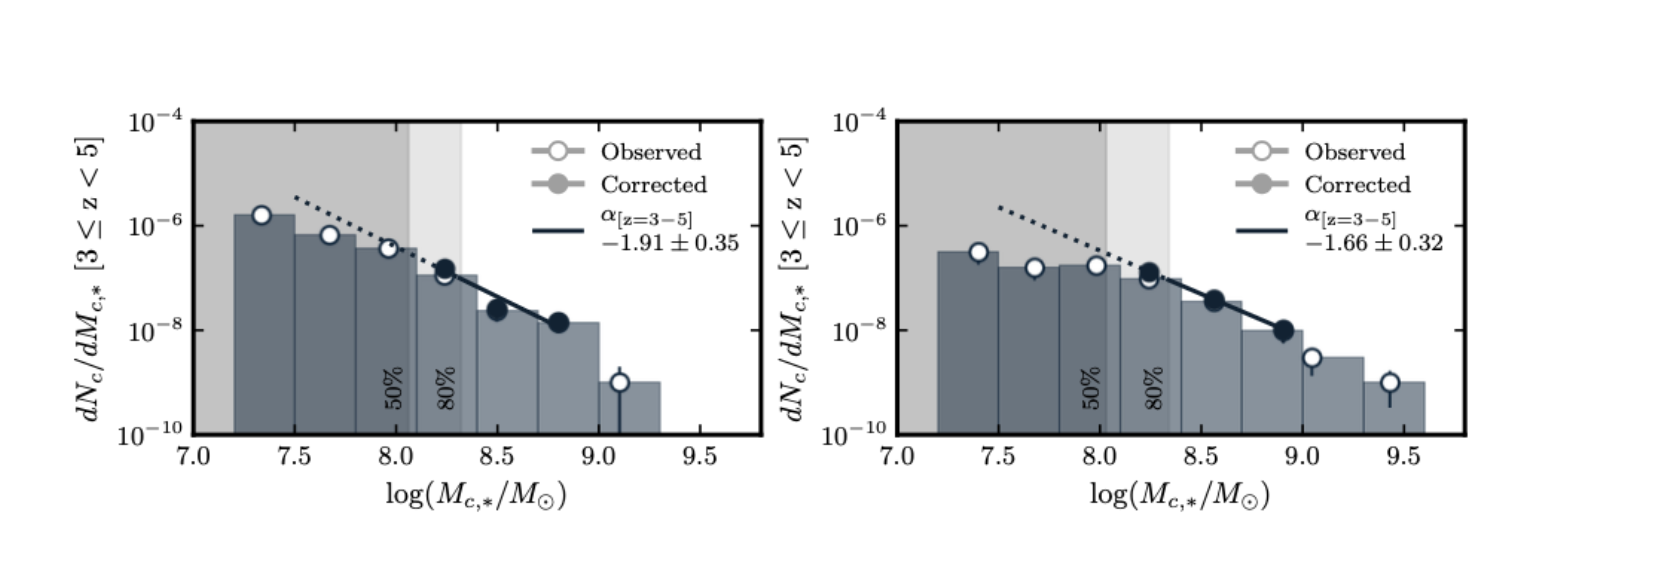
But when the authors separated the clump sample by host galaxy mass, the picture became more interesting (see Figure 3). In more massive galaxies (above about 10¹⁰ solar masses), the cSMFs have flatter slopes, roughly –1.6, which means these galaxies host proportionally more heavy clumps. In smaller galaxies, the cSMFs have steeper slopes closer to –2.3, indicating populations dominated by lighter clumps. This connection points toward the idea that a galaxy’s own environment – its gas content, disk size, and internal motions – helps set the balance between large and small clumps.
What Controls the Shape of the Clump Population?
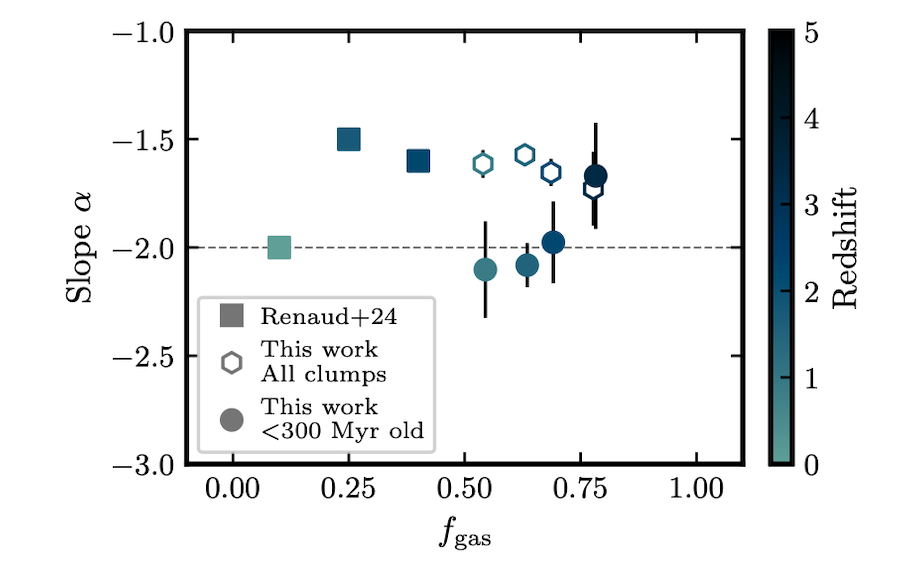
Why would massive galaxies host proportionally more heavy clumps? One explanation is gas content. In theory, gas-rich disks are more unstable and can collapse into larger fragments. When the team estimated gas fractions using scaling relations, they found a mild trend: galaxies with higher gas content tend to show shallower cSMF slopes (closer to –1.6), meaning more massive clumps relative to small ones.
However, when considering only the youngest clumps (< 300 Myr, filled symbols in Figure 4), the slopes shift closer to –2, which is actually steeper. This likely reflects a larger population of recently formed low-mass clumps that have not yet been disrupted or merged. Over time, dynamical effects or clump mergers may preferentially remove or grow low-mass clumps, flattening the slope toward –1.6 in the full population.
Another factor may be ex-situ clumps, formed in smaller satellite galaxies that later merged with the host. These accreted clumps tend to be more massive, which can also flatten the mass function. In reality, both processes, in-situ gas fragmentation and ex-situ accretion, are likely shaping the clump population.
The Fate of Clumps: Survival or Destruction
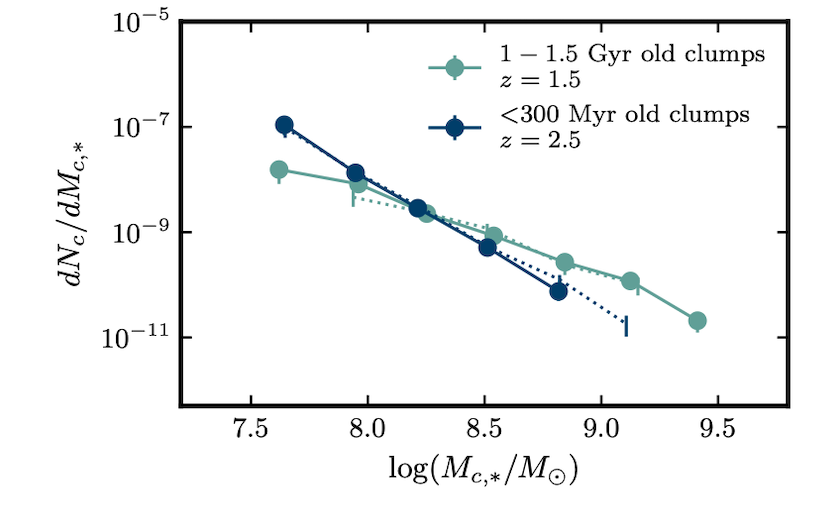
Not all clumps live long. Stellar winds, radiation, and supernovae can blow away the gas that holds a clump together, dispersing it into the galaxy’s disk. To test how this affects the population, the authors compared young clumps (< 300 Myr, at higher redshift) to older ones (≈ 1–1.5 Gyr, at lower redshift) in massive galaxies.
As shown in Figure 5, the mass function of the younger group is steeper, meaning many low-mass clumps are present. The older population lacks these lighter clumps and instead has a flatter slope. This difference can’t be explained by simple stellar aging – instead, it suggests that low-mass clumps are gradually destroyed while the massive ones endure. Some of this effect may also reflect cosmic evolution, as lower-redshift galaxies tend to be less gas-rich and dynamically calmer.
Taken together, these results point toward a picture of “clump evolution”: galaxies constantly form many small, short-lived clumps, but only the most massive ones survive long enough to grow or migrate inward. Those survivors withstand both feedback and dynamical shear (the galaxy’s rotation tugging on clumps at different speeds and stretching them apart if they aren’t dense enough). Over time, these long-lived clumps can spiral toward the galactic center and contribute to the growth of bulges.
Why It matters
Studying how clumps form and die is key to understanding how galaxies build their structure. Long-lived, massive clumps can move gas and stars inward and fuel bulge growth. If most clumps are short-lived, on the other hand, then their light marks only brief flashes of intense star formation.
Imaging alone cannot yet tell whether these clumps are truly bound structures (real self-gravitating blobs) or merely overlapping bright regions along our line of sight. Future JWST (IFU) spectroscopy will reveal their internal motions and chemistry, helping distinguish clumps that formed in place from those brought in by mergers and interactions. Sok et al.’s results lay the groundwork for those future tests, offering a statistical view of how clumps form, evolve, and fade within their host galaxies.
Astrobite edited by Sarah Stevenson
Featured image credit: JWST CANUCS survey – MACS J1423 – CANUCS Team (modified by Niloofar Sharei)