Authors: Kabelo Tsiane, Sidney Mau, Alex Drlica-Wagner, Jeffrey L. Carlin, Peter S. Ferguson, Keith Bechtol, Ethan O. Nadler, Annika H. G. Peter, Yao-Yuan Mao, Adam J. Thornton, The LSST Dark Energy Science Collaboration
First Author’s Institution: Department of Physics, University of Michigan, Ann Arbor, MI 48109, USA
Status: Published in The Open Journal of Astrophysics (2025 July 10) [open access]
The astronomers’ shiny new toy
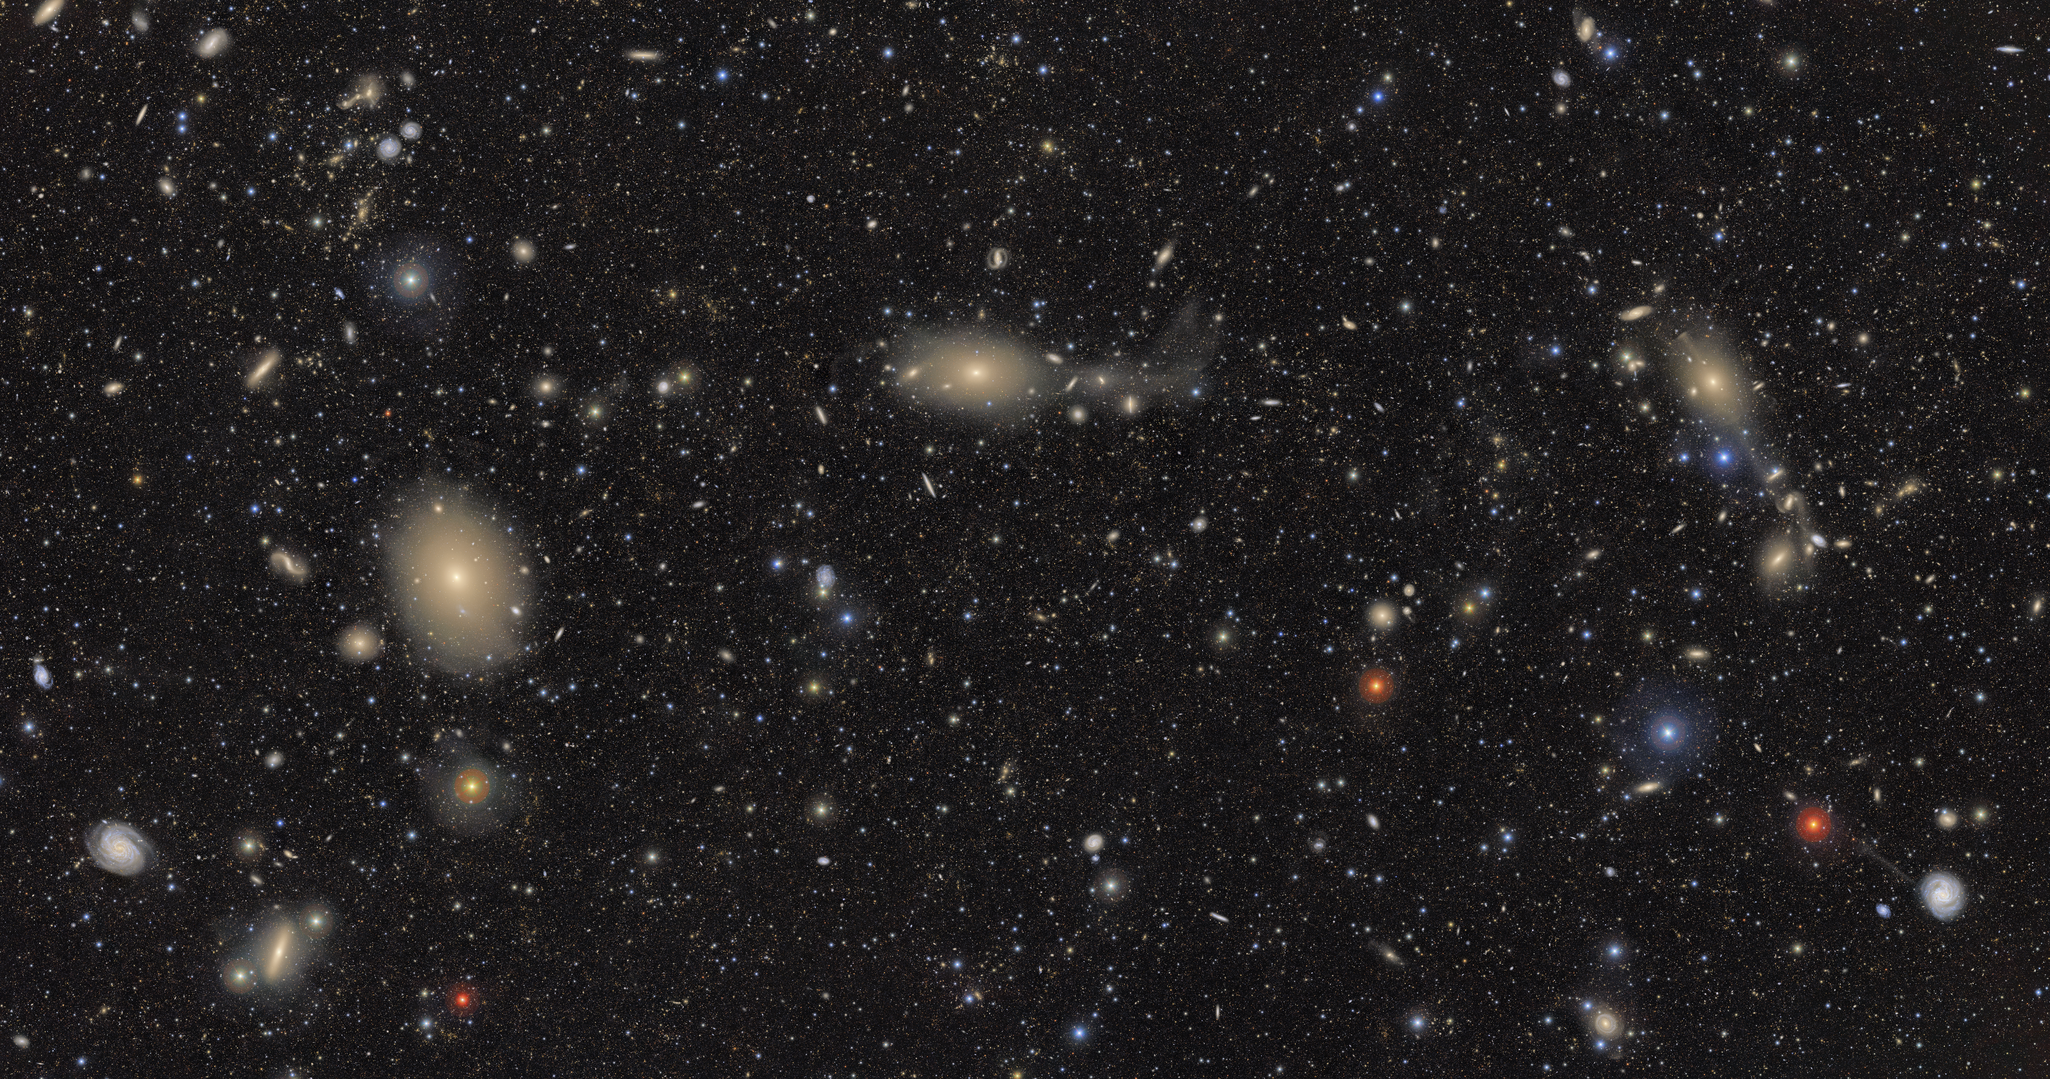
Nestled atop Cerro Pachón in the Chilean Andes is the Vera C. Rubin Observatory, the shiny new toy that’s getting astronomers excited for a deluge of new astronomical data. On June 23rd, Rubin unveiled some stunning First Look images taken with its 3200-megapixel camera—the largest ever built. Among these First Look images is the immensely detailed “Cosmic Treasure Chest” (Figure 1), capturing over 10 million galaxies in their various forms, colors, and distances.
After a decade of construction, Rubin will finally begin its 10-year Legacy Survey of Space and Time (LSST) in just a few months. This survey promises an “ultrawide, ultra-high-definition time-lapse record of the Universe” and will generate an estimated 20 terabytes of data per night. Rubin data will help astronomers answer four core science questions: How did the Milky Way form? What is the nature of dark matter and dark energy? What new objects are we yet to discover in the Solar System? What new discoveries await when we track the changes in the night sky?
What might Rubin find?
Key to answering the first science question above (“How did the Milky Way form?”) is Rubin’s exceptional capability of detecting extremely faint and extremely tiny objects.
Because galaxies form by merging smaller objects to create bigger objects (“hierarchical formation”), understanding the formation of the Milky Way requires a census of all the things—big and small—that built it up. Some of these building blocks are still mostly intact, i.e., not yet ripped apart by the Milky Way’s tidal forces, and they currently live on the outskirts of our Galaxy. These surviving building blocks, which we can call “satellites,” include distant dwarf galaxies and star clusters bound to the Milky Way.
At this point, we believe we’ve probably discovered all the big and bright satellites. However, we are far from detecting all the small and faint ones—because they’re simply harder to see. With Rubin’s ability to peer wider and deeper than any other telescope, we might get closer to a complete census of Milky Way satellites. But what exactly might Rubin find?
Today’s paper, by Tsiane and colleagues, takes the expected capabilities of Rubin and predicts how it would detect the tiniest things surrounding the Milky Way. How many satellite galaxies will it discover? At what sizes, distances, and luminosities? What challenges will make the detection of tiny things difficult? This paper’s conclusions will then help astronomers prepare for the flood of real Rubin data.
Simulating the flood
To prepare for the deluge of Rubin data, the authors begin with the DC2 Simulated Sky Survey, a gigantic simulated dataset that mimics the real LSST dataset. They then inject 100,000 of their own simulated satellite galaxies into the DC2 catalog. These simulated satellites span a large range of distances, stellar masses (or luminosities), sizes, and shapes, among other properties. The question is now: Which of these satellites will LSST be expected to find?
To simulate a satellite search through LSST-like data, the authors apply the same automated method used in the Dark Energy Survey (DES), a precursor survey to the LSST. This algorithm is well-suited for detecting faint objects against a background of stars and galaxies. After applying this algorithm to their simulated catalog, the authors obtain a list of detected and non-detected satellites, summarized in Figure 2 (Figure 6 in today’s paper).
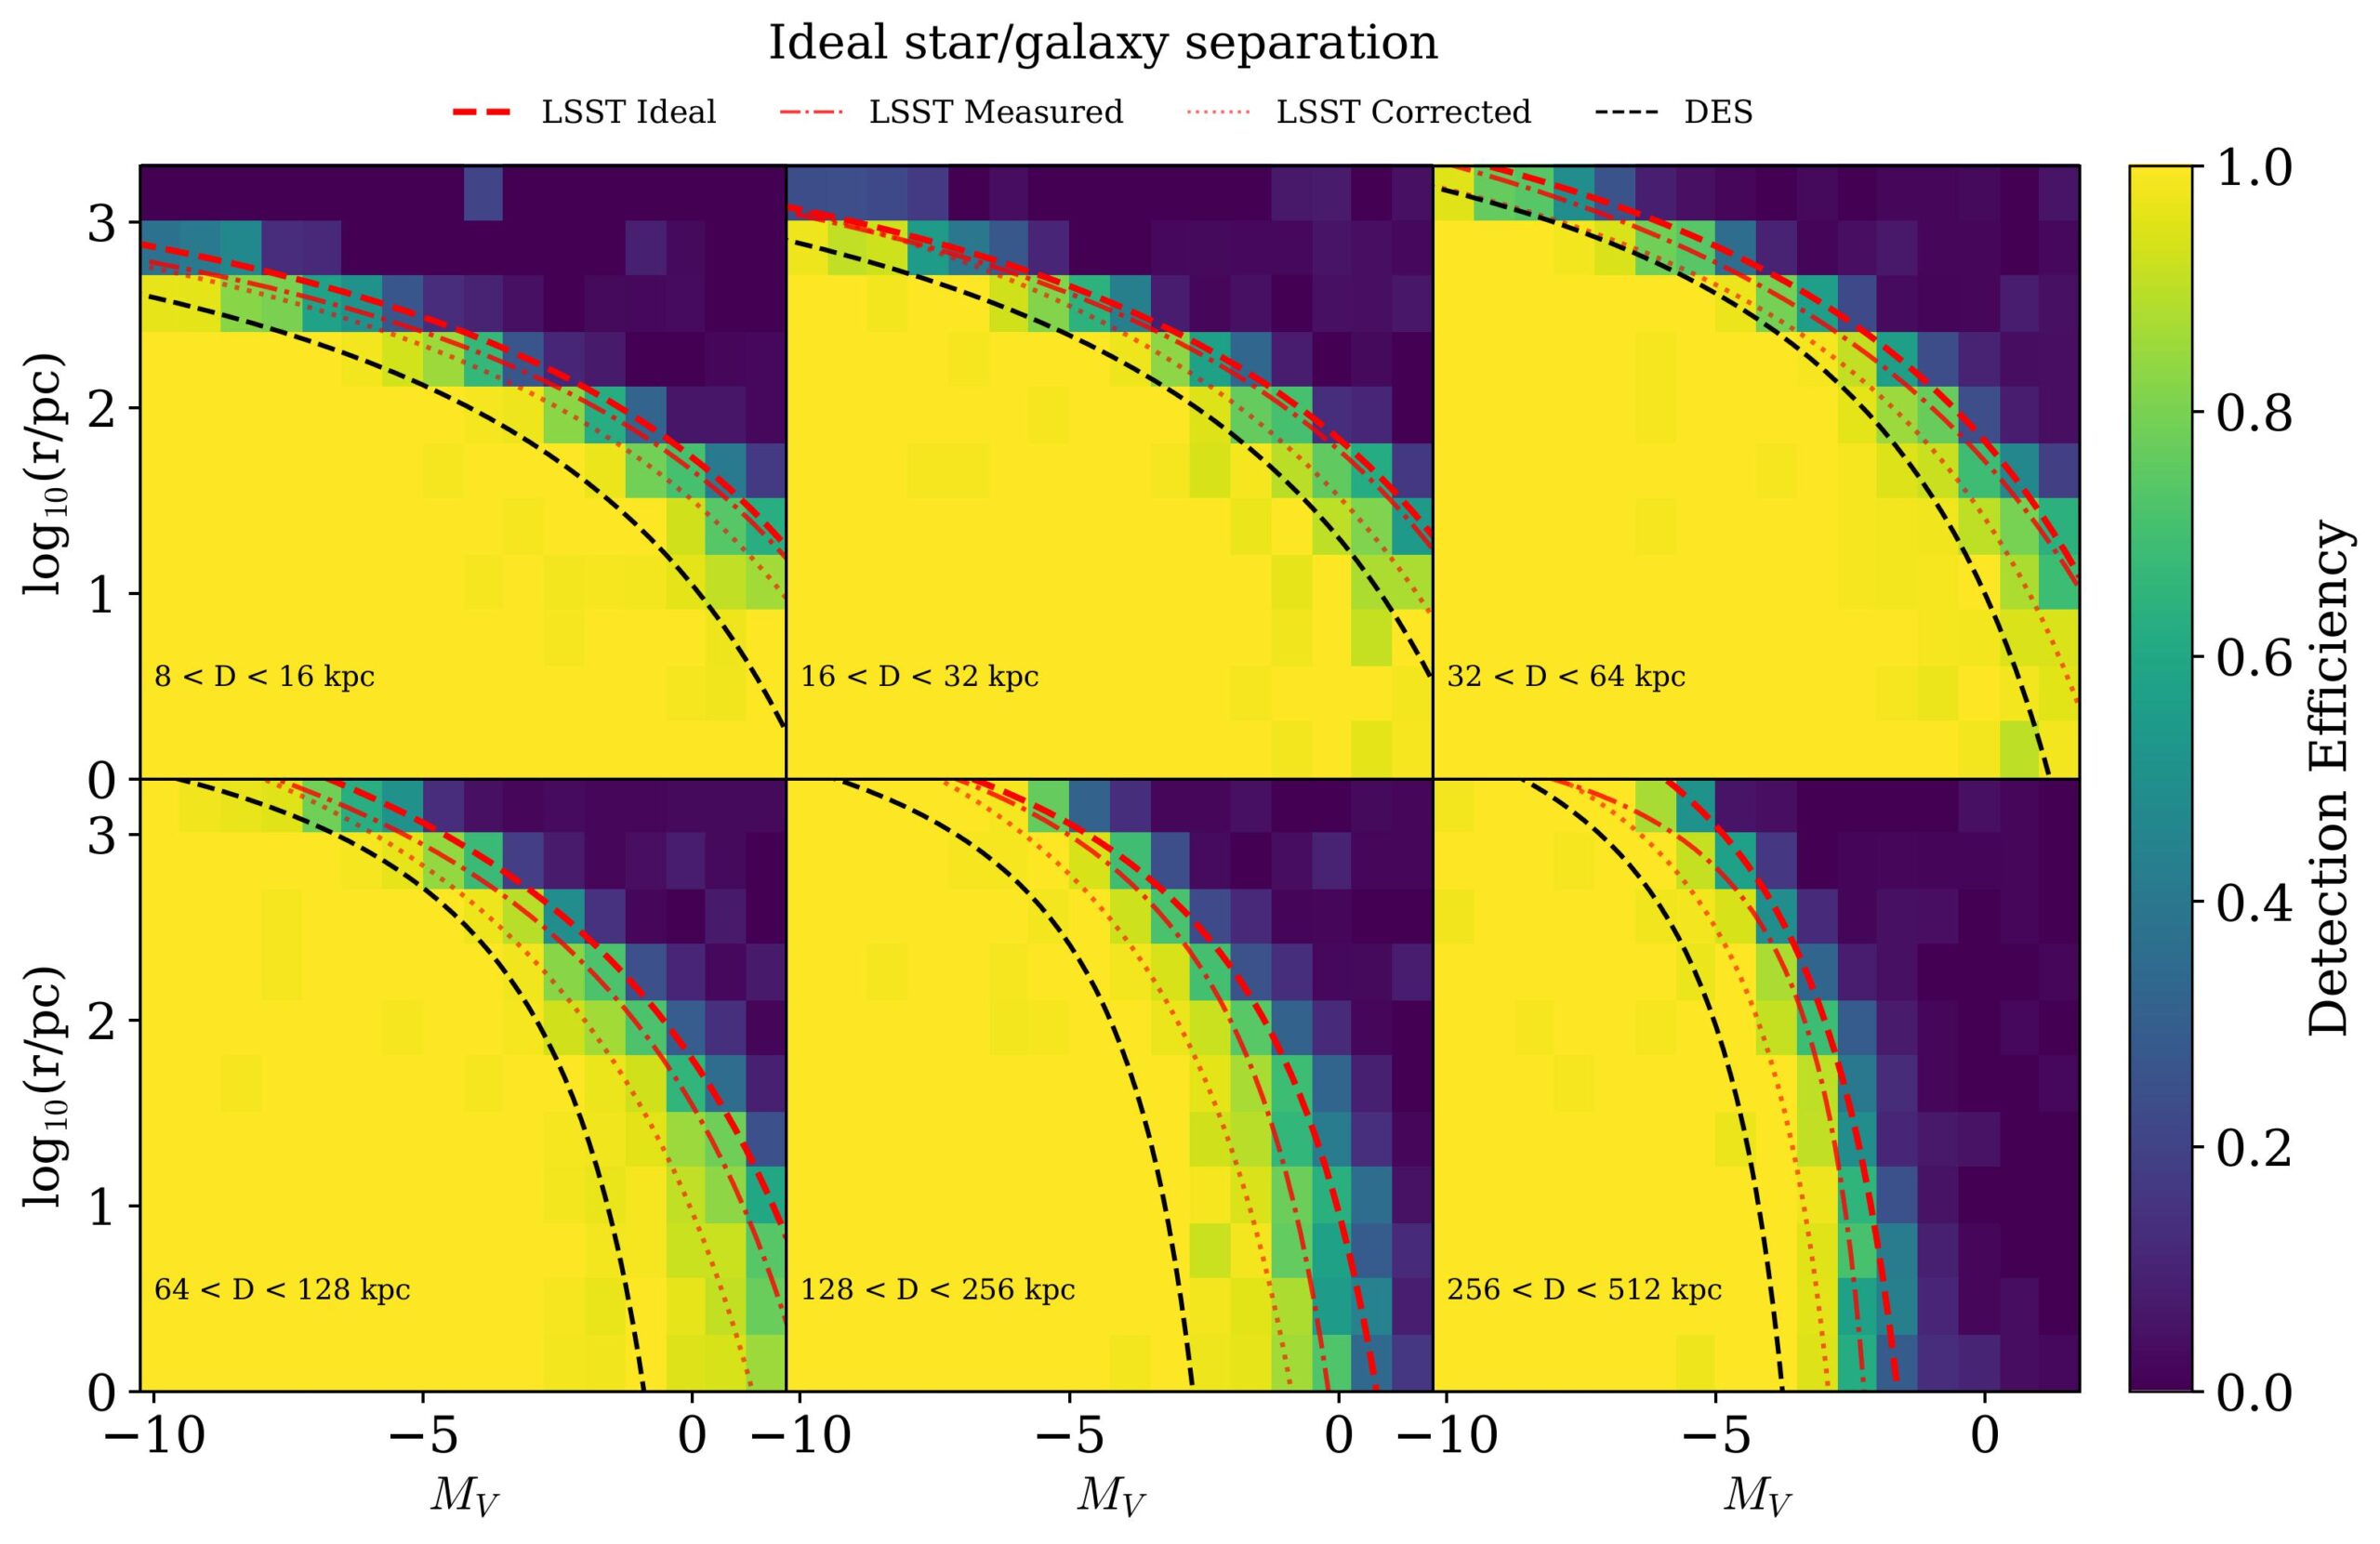
From the lower left corner of each panel in Figure 2, we see that bright and compact systems are always detected because they easily stand out from the background. On the other hand, nearby bright systems can be hard to detect because they appear too diffuse in the sky (purple region in the top left corner of the upper left panel). At large distances, faint objects of all sizes are harder to detect simply because, well…they are too faint.
Compared to the performance of DES, LSST is noticeably better at detecting far, faint, and compact systems. One can see this in the bottom panels, noting how much fainter the LSST lines go compared to the DES line (objects with more positive magnitudes are fainter).
Predicting the flood
Now that the authors have an idea of LSST’s detection capability, they ask: how would LSST fare at detecting real satellites at various absolute magnitudes, sizes, and distances? To answer this, we first need to know how many real satellites around the Milky Way have a particular absolute magnitude, size, and distance.
Fortunately, a “galaxy-halo model” can give us an approximate answer. This model predicts that there should be almost 300 satellites with absolute magnitudes brighter than 0 (more negative than zero), half-light radii greater than 10 pc, within a distance of 300 kpc. These predictions are illustrated in the blue region of Figure 3 (Figure 8 in the paper).
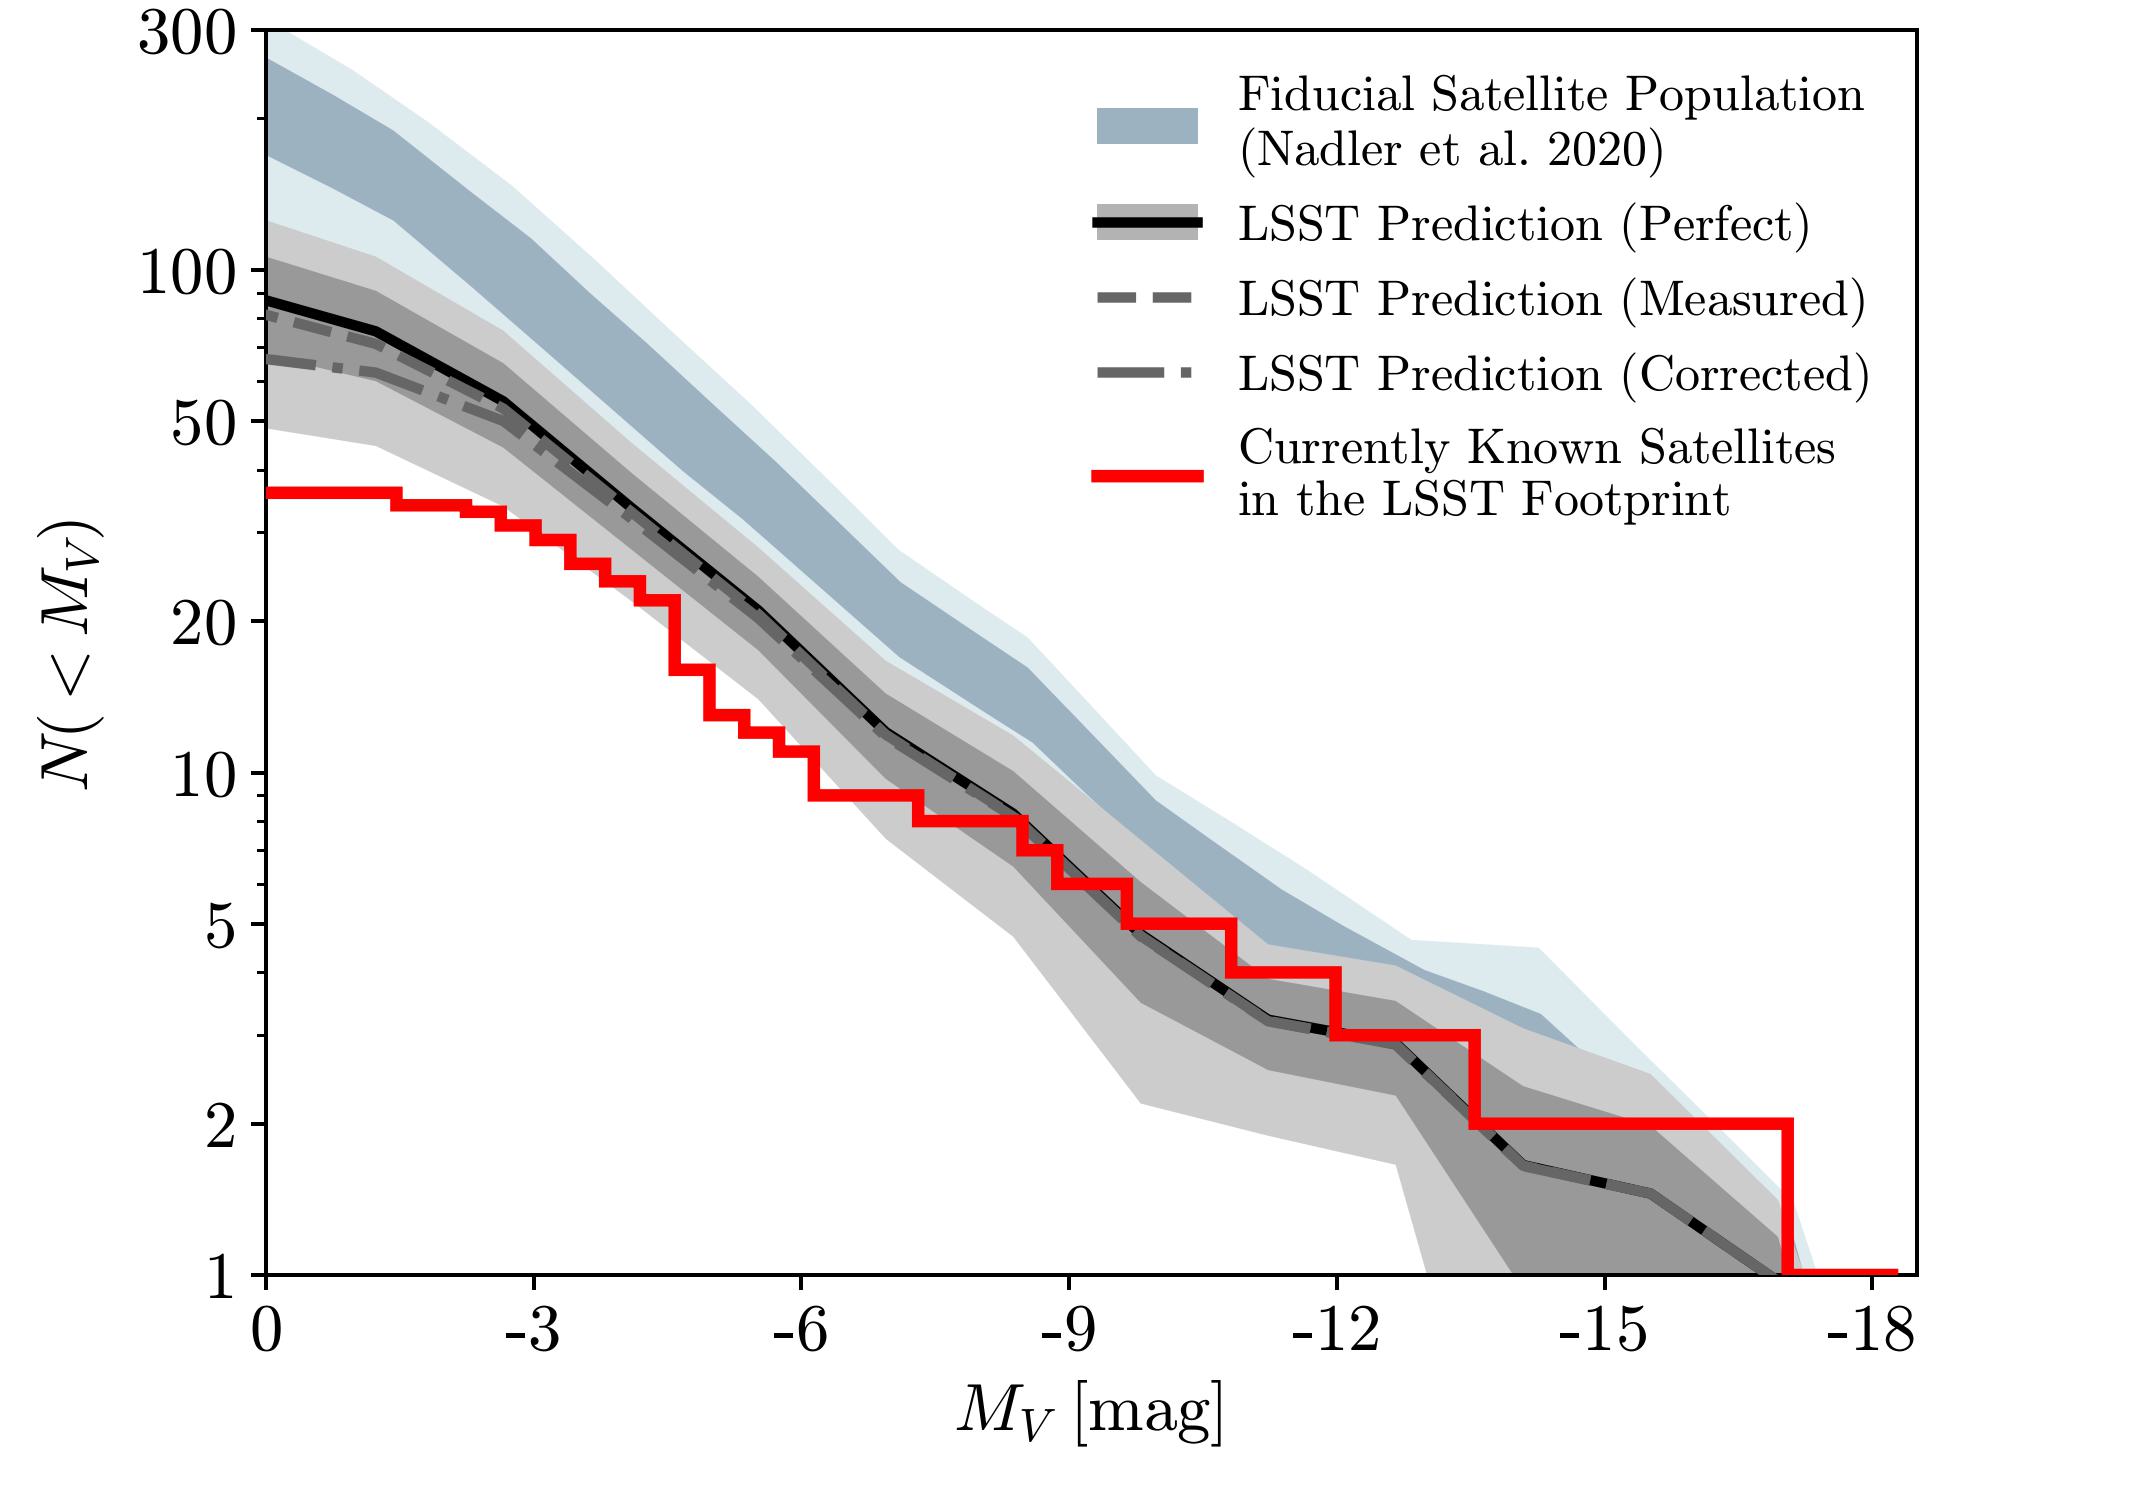
Out of this “true” population, how many would LSST find given its capabilities? The authors find that LSST is expected to detect around 89 satellites (black solid line in Figure 3), of which 36 are already known (red solid line).
Unfortunately, the challenge of star/galaxy separation might lower LSST’s detection efficiency (dashed and dot-dashed gray lines). In LSST images, very distant galaxies (which we don’t want) can convincingly masquerade as faint Milky Way stars (which we want). Correctly distinguishing galaxies from nearby stars is therefore paramount in maximizing the detection capabilities of LSST. With perfect separation, LSST could discover 53 new satellites; but under less than ideal conditions, that number drops to 31. Imagine missing out on the discovery of more than 20 new satellites!
Going farther, fainter, and more compact
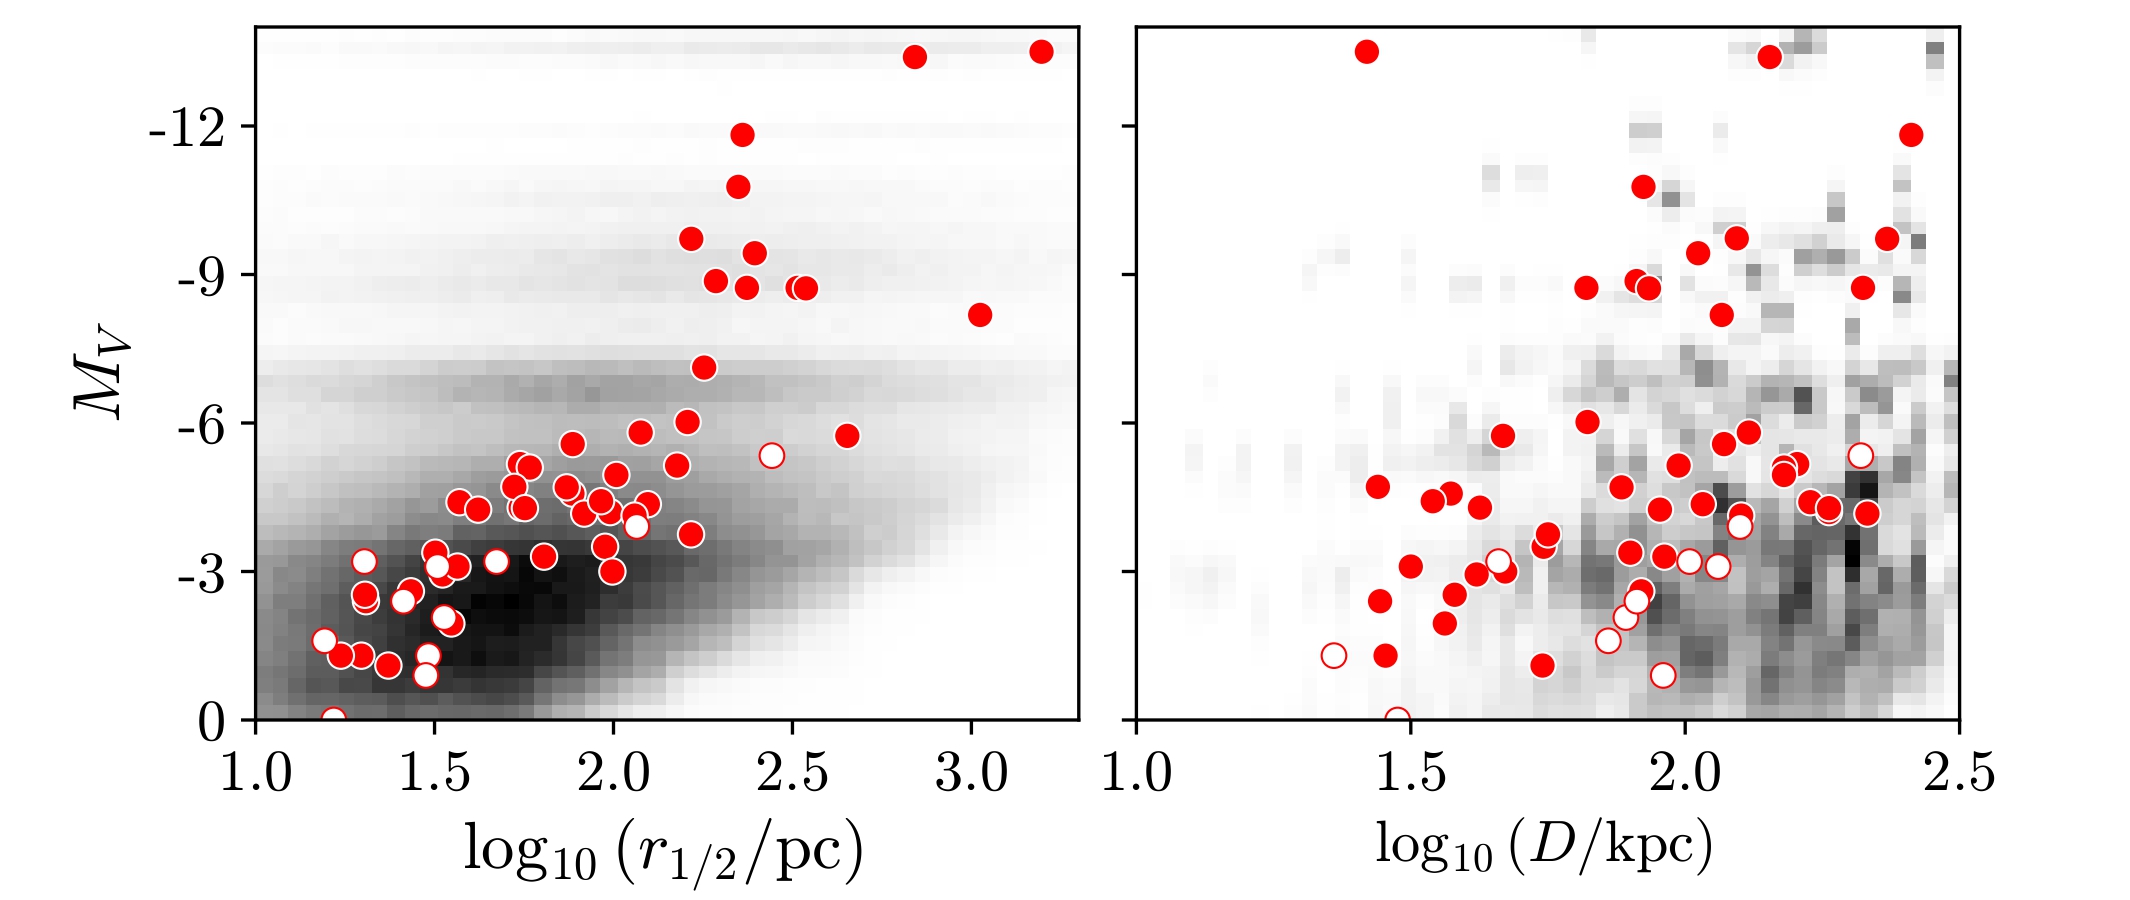
Far, faint, and compact—these are the types of satellites that LSST will likely discover. Figure 4 (Figure 9 in the paper) shows the known satellites (red circles) and the potentially detectable satellites with LSST (gray areas). This plot makes it clear that LSST will reveal objects we’ve never seen before.
Very soon, Rubin will begin its flagship survey. Today’s authors have shown, in detail, how this decade-long survey will allow us to see much farther and much fainter objects than we’ve ever seen before. This richer view of the Universe will deepen our understanding of how the Milky Way and other galaxies formed, how heavy elements were created, and how dark matter shapes the Universe.
What tiny things have been lurking around our Milky Way this whole time?
Astrobite edited by Niloofar Sharei
Featured image credit: NSF–DOE Rubin Observatory/P.J. Assuncao Lago