Title: Alcock-Pacyński test on reionization bubbles for cosmology
Authors: Thélie, E., Del Balso, F., Muñoz, J. B., & Liu, A.
First Author’s Institution: Department of Astronomy, University of Texas at Austin, 2512 Speedway, Austin, TX 7812
Status: published in Physical Review D [closed access]
Ionising the Universe
In the very early universe, the space between galaxies was filled with neutral hydrogen and helium, known as the intergalactic medium (IGM). Light from early galaxies leaked into the neutral IGM and slowly started to ionise the gas. Only 1 billion years after the beginning of the universe, the IGM was completely ionised, and the process of “reionisation” was complete. The IGM has remained ionised for the rest of the universe’s history.
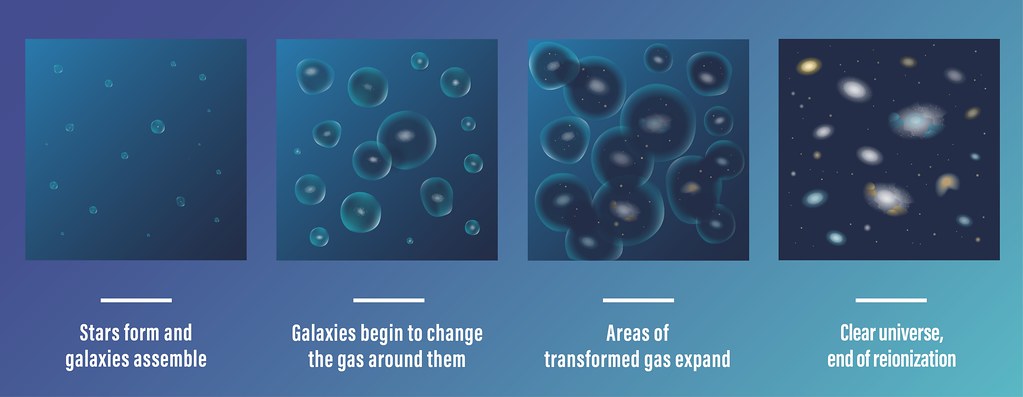
As you can see in Figure 1, the edge of the ionised region begins very close to the galaxy (leftmost panel) and gradually moves outwards, creating a bubble of ionised gas around each galaxy (second panel from the left). The ionised gas bubbles eventually get big enough to overlap with neighbouring bubbles (second panel from the right), and once all the bubbles overlap with each other, the universe becomes completely reionised (rightmost panel). From the figure, you can see that although individual bubbles aren’t perfectly spherical, the average shape is a sphere. In other words, there is no preferred direction for reionisation. Today’s authors leverage this simple geometric argument to show how IGM bubbles could be used to learn more about the universe’s cosmology.
Mapping the Intergalactic Medium
But first, we need to understand how astronomers observe these ionised bubbles, using a technique called IGM tomography. Neutral hydrogen can emit light at a wavelength of 21cm through a process known as a spin-flip transition. This light travels to us through an expanding universe, causing the wavelength to be stretched out and be slightly longer by the time we observe it. The further away the light was originally emitted, the more stretched out (or redshifted) the light will be. As a result, astronomers can take a 2D observation of the sky and turn it into a 3D map of neutral hydrogen. Ionised hydrogen does not emit light at 21cm, meaning that ionised bubbles will show up as dark regions in a 21cm map of the IGM.
However, the redshift (z) only gives us relative distance information. If the light from one region in space is more redshifted than light in a second region, then we know that the first region must be further away, but exactly how far away it is depends on how quickly the universe is expanding. The speed of the expansion of the universe is characterised by the Hubble parameter, H(z). Similarly, converting the apparent size of an ionized bubble on the sky to an actual physical size also depends on the cosmology of the universe.
Measuring Bubble Sizes
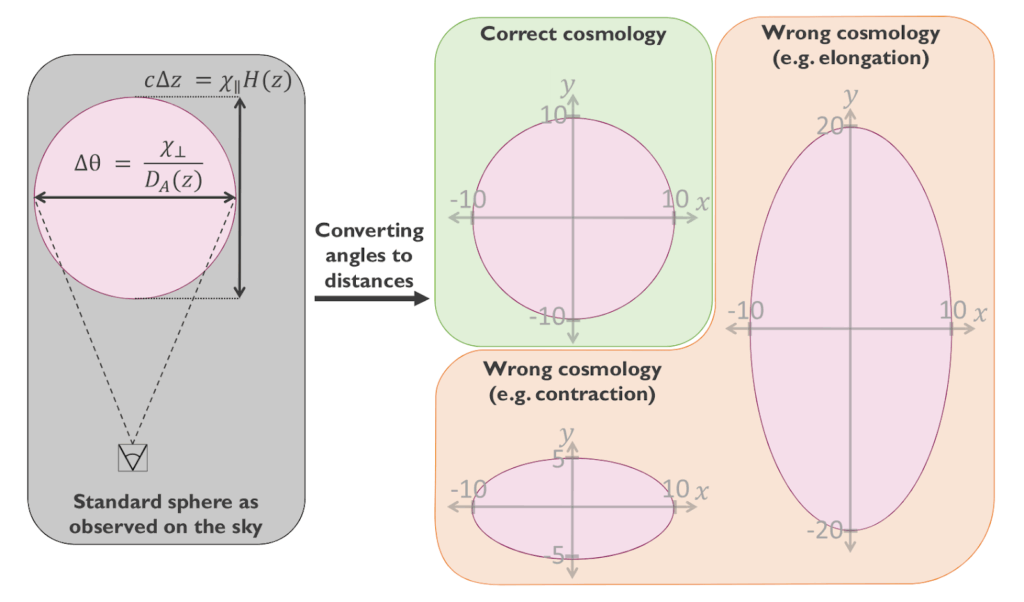
Figure 2 shows how converting the directly measured angular size and redshift difference across the ionised bubble depends on the assumed cosmology. Assuming the bubble is truly spherical, only the correct set of cosmological parameters will preserve the spherical shape of the bubble; incorrect assumptions about the universe’s cosmology will result in an elliptical bubble.
A single bubble is rarely a perfect sphere, so we can’t rely on a single measurement of a bubble to learn more about cosmology. However, since bubbles should average out to a sphere, today’s authors argue that future surveys of 21cm emission will be able to stack bubble observations into an average observation that can be used as a test of cosmology. This method is known as an Alcock-Paczyński test.
The authors use the 21cmFAST simulation to construct mock observations of 21cm emission. While current telescope facilities can’t produce maps like this just yet, radio interferometers like the Square Kilometre Array (SKA) will likely be able to produce detailed 21cm maps within the next few years, so the authors use simulated data to illustrate how their proposed test could be applied in the future. The simulated data includes emission from regions of neutral hydrogen that are much closer to us than the neutral IGM. As a result, the light from these foreground sources is much brighter than the IGM signal, making it challenging to properly subtract while still preserving the faint IGM signal. To extract the density of neutral hydrogen in the IGM, the authors use a neural network.
The authors then stack the bubbles and apply different cosmological assumptions (different rows of Figure 3) to convert redshifts and angular sizes to physical sizes. They do this using three different methods of bubble extraction: one is taken directly from the simulated IGM (left column of Figure 3 – the ground truth), another removes foreground sources and uses a neural network to recover bubbles (middle column), and the third adds observational noise and foreground sources to the simulated IGM and uses the same neural network to recover bubbles (right column). The rightmost column matches what we might expect to observe most closely, and the other two columns provide a good sanity check, assuring us that the foreground and noise are not introducing any kind of bias.
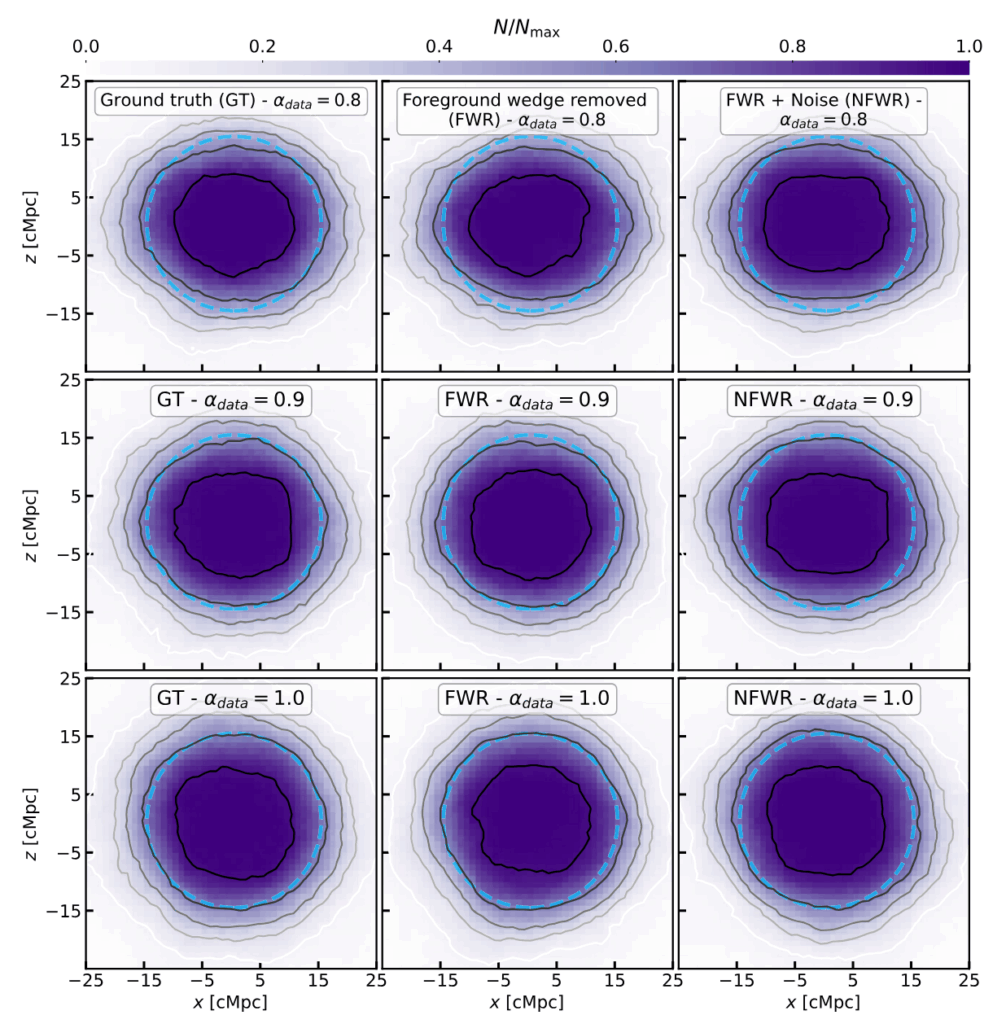
In Figure 3, you can see that the physical bubble sizes best match a perfect circle (blue dashed lines) on the bottom row. This is where the assumed cosmology best matches the cosmological parameters used to construct the IGM map. Of course, when astronomers get to apply this technique to real data, we won’t know what the “true” cosmology is, but using chi-squared tests, the authors show that the bottom row is statistically a much better match than any other set of cosmological parameters. In fact, the authors predict that bubble stacking will be able to constrain the product of two key cosmological parameters, the Hubble parameter and the conversion from angular size to physical size, to a precision of 2%.
Stacking bubbles observed in 21cm maps could therefore give astronomers a real handle on the cosmology of the universe. Comparing the results of this analysis to other independent measurements of cosmological parameters will highlight any tensions between methods and ultimately result in a more robust understanding of cosmology.
Astrobite edited by Alexandra Masegian
Featured image credit: Jingchuan Yu, Beijing Planetarium