Title: Linking Fermi blazars and radio galaxies through accretion and jet radiation mechanisms
Authors: Xu-Hong Ye, Ranieri D. Baldi, Wen-Xin Yang, Jing-Tian Zhu, Denis Bastieri, Rumen S. Bachev, Anton A. Strigachev, Jun-Hui Fan
First Author’s Institution: Dipartimento di Fisica e Astronomia “G. Galilei”, Università di Padova, Via F. Marzolo, 8, I-35131 Padova, Italy.
Status: Accepted by Astronomy & Astrophysics. [open access]
Welcome to the AGN Zoo
The question the authors of today’s paper are attempting to answer is: “How do the eating habits (accretion) of active galactic nuclei (AGN) affect the light emitted for different types of AGN?”
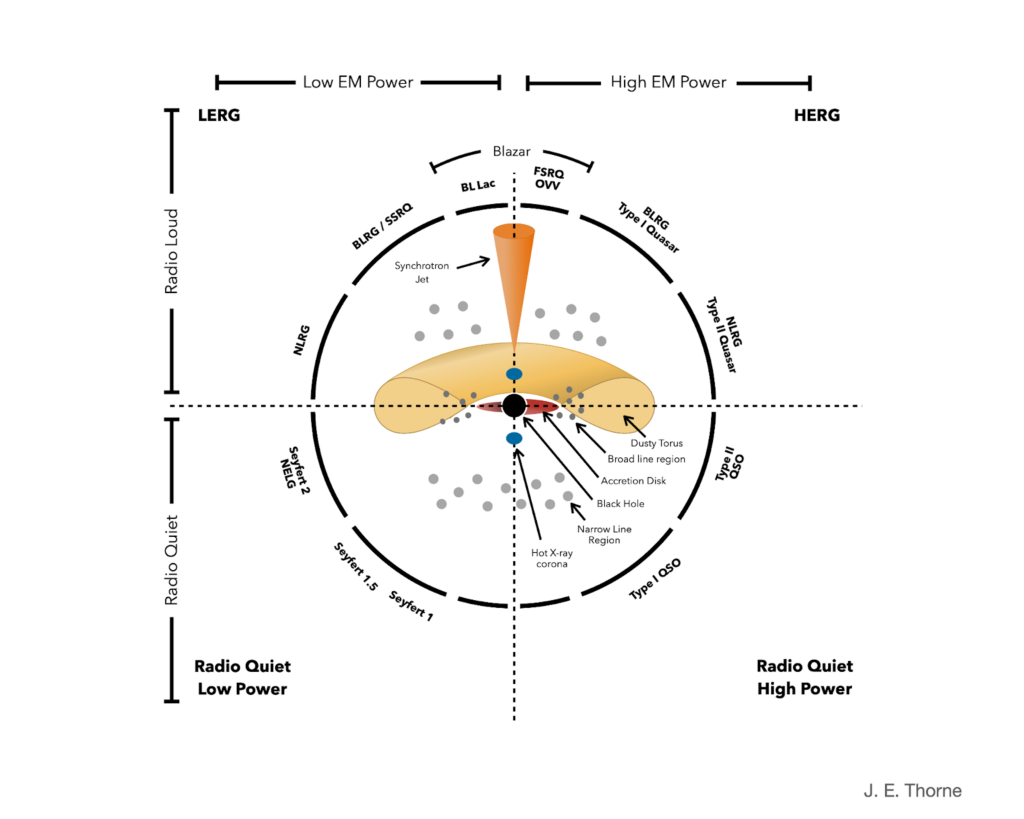
If you haven’t heard of an AGN before, check out this link. As a brief summary, AGN emit light across the electromagnetic spectrum powered by accretion on a central black hole. They are divided into those with jets (radio loud) and those without jets (radio quiet). There are many subtypes within these two classifications, as shown in Figure 1. The Unified Model of AGN proposes that many of these objects have the same underlying physics, with the differences in their observed properties based on the viewing angle. In the same way, a car looks different depending on whether you are staring directly into the headlights or looking at it from an angle, but it is still a car.
The authors of today’s paper focus on AGN with jets (upper half of Figure 1). These include High-Excitation Radio Galaxies (HERGs), which are brighter, more efficient and have strong optical emission lines, and Low-Excitation Radio Galaxies (LERGs), which are dimmer, less efficient, and lack strong optical emission lines. Under the AGN unification scheme, blazars are just radio galaxies, but we are looking directly into their headlights (jets). The authors also look at two types of blazars: BL Lacertae type objects (BL Lacs) and Flat Spectrum Radio Quasars (FSRQs).
The AGN Exhibit Viewing Area
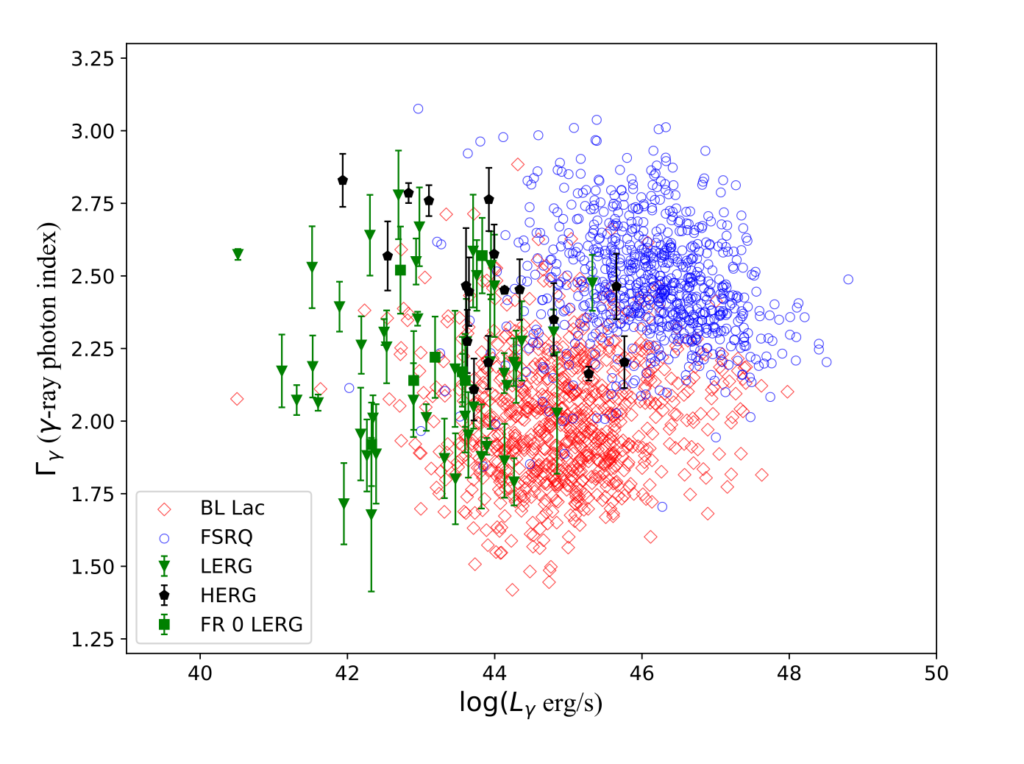
After applying selection criteria, the authors looked at observations of 838 BL Lacs, 784 FSRQs, 55 LERGs, and 17 HERGs by the Fermi Large Area Telescope. First, the authors plotted the gamma-ray photon index (which tells us how the brightness changes for different energy gamma rays) against the gamma-ray luminosity, as shown in Figure 2. They noted that, in agreement with previous studies, the BL Lacs and FSRQs show different distributions, which suggests they use different mechanisms to make the gamma rays. They also noted that HERGs and LERGs show different behaviour to each other, with LERGs more similar to BL Lacs and HERGs more similar to FSRQs. However, the authors noted that one potential drawback of this method is that it is susceptible to observational bias due to farther objects being harder to see.
Feeding Time at the Zoo
A spectral energy distribution (SED) is a plot of flux vs wavelength, which shows how a source’s radiation is distributed across the electromagnetic spectrum. For an AGN, it has two peaks, with the lower energy peak due to synchrotron emission (photons emitted by fast electrons in a magnetic field) and the higher energy peak due to inverse-Compton scattering (upscattering of a photon to a higher energy by an electron) in the simplest model. Inverse-Compton scattering can be divided into two types: synchrotron self-Compton (SSC) scattering, where the photon being scattered comes from the synchrotron radiation of the same population of fast electrons; or external-Compton (EC) scattering if the photon comes from somewhere else.
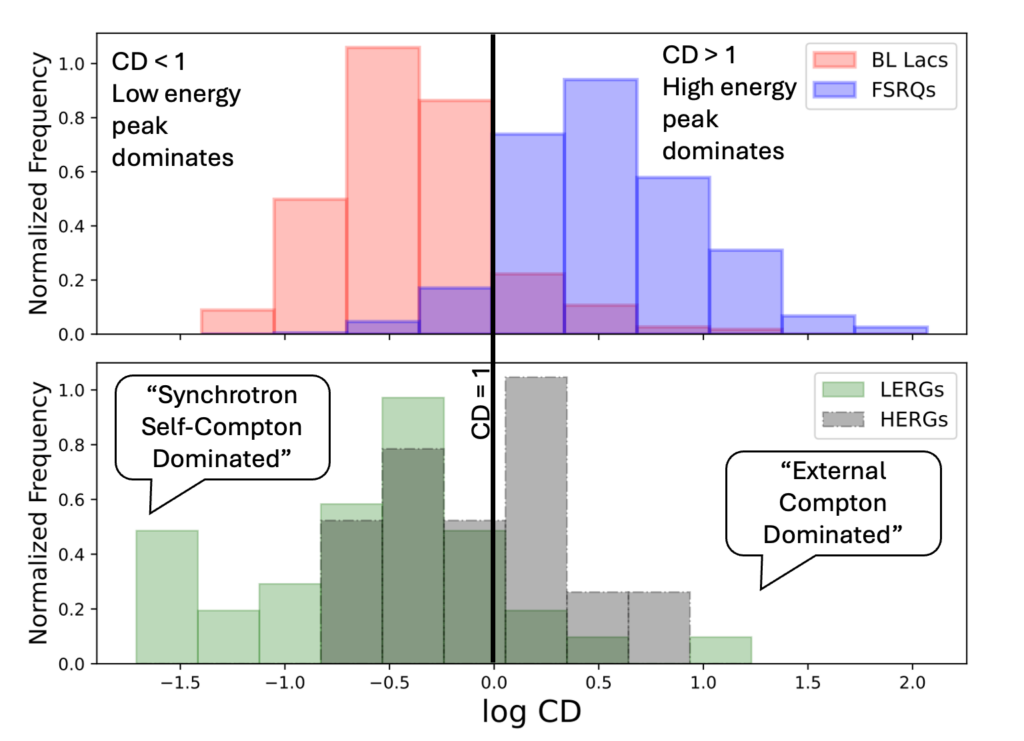
Next, the authors looked at a parameter that is not affected by distance to the AGN. The Compton Dominance (CD) parameter is effectively a ratio of how bright the AGN’s high-energy peak (due to inverse-Compton scattering) is compared to its low-energy peak (due to synchrotron emission) and is independent of observational bias due to the AGN’s distance. CD is a useful indicator of accretion (feeding) rate in jetted AGNs. In Figure 3, we can see a histogram of log(CD), which shows that BL Lacs and FSRQs have different CD distributions in the top panel and that LERGs and HERGs have different CD distributions in the bottom panel. Similar to the authors’ analysis of Figure 2, HERGs are similar to FSRQs, and LERGs are similar to BL Lacs. This tells us that the emission of FSRQs and HERGs is dominated more by inverse-Compton scattering than BL Lacs and LERGs. The authors explain that this is due to a change in the underlying mechanism for the inverse-Compton scattering at the CD = 1 line from SSC-dominated to EC-dominated and identify two different AGN eating habits:
- A low accretion rate state can be explained by the SSC model, which describes BL Lacs and LERGs.
- A high accretion rate state can be explained by the EC model, which describes FSRQs and HERGs
“Paws”-ing to reflect on the AGN Zoo
The authors conclude that an AGN’s eating habits (accretion) do affect the light emitted from the AGN. However, they identify some of the creatures in the AGN zoo to have the same underlying physics and therefore are likely to be the same type of object, just viewed from different angles. This provides further evidence for the unified AGN model, with BL Lacs being LERGs with the jet pointing directly at us, while FSRQs are HERGs with the jet pointing directly at us.
Astrobite edited by: Ben Sherwin and Shalini Kurinchi-Vendhan
Featured image credit: Adapted from AGN Unification Diagram by Jessica Thorne, Aaron Robotham, Luke Davies, and Sabine Bellstedt.