Title: Characterizing Gamma-Radio Delayed Flaring Activity from Blazars
Authors: Alina Kochocki, Emma Kun, and Sam Hori
First Author’s Institution: Department of Physics and Astronomy, MSU, East Lansing, MI 48823, USA
Status: Available on arXiv
Blazars, active galactic nuclei blasting jets of radiation towards Earth, are known for their variability in brightness across the electromagnetic spectrum. In the past, many studies have looked at the correlation between blazar’s brightness at different wavelengths. Some studies have even looked for delays of a few months between flaring in different wavelengths. In a similar way to the time delay between lightning and thunder being used to find the distance to a storm, the delay between radio and gamma-ray flares can be used to find different properties of the blazar. For example, the ratio of how bright a blazar is in gamma-rays and radio waves can tell us about details such as the density of particles and the magnetic field of the blazar.
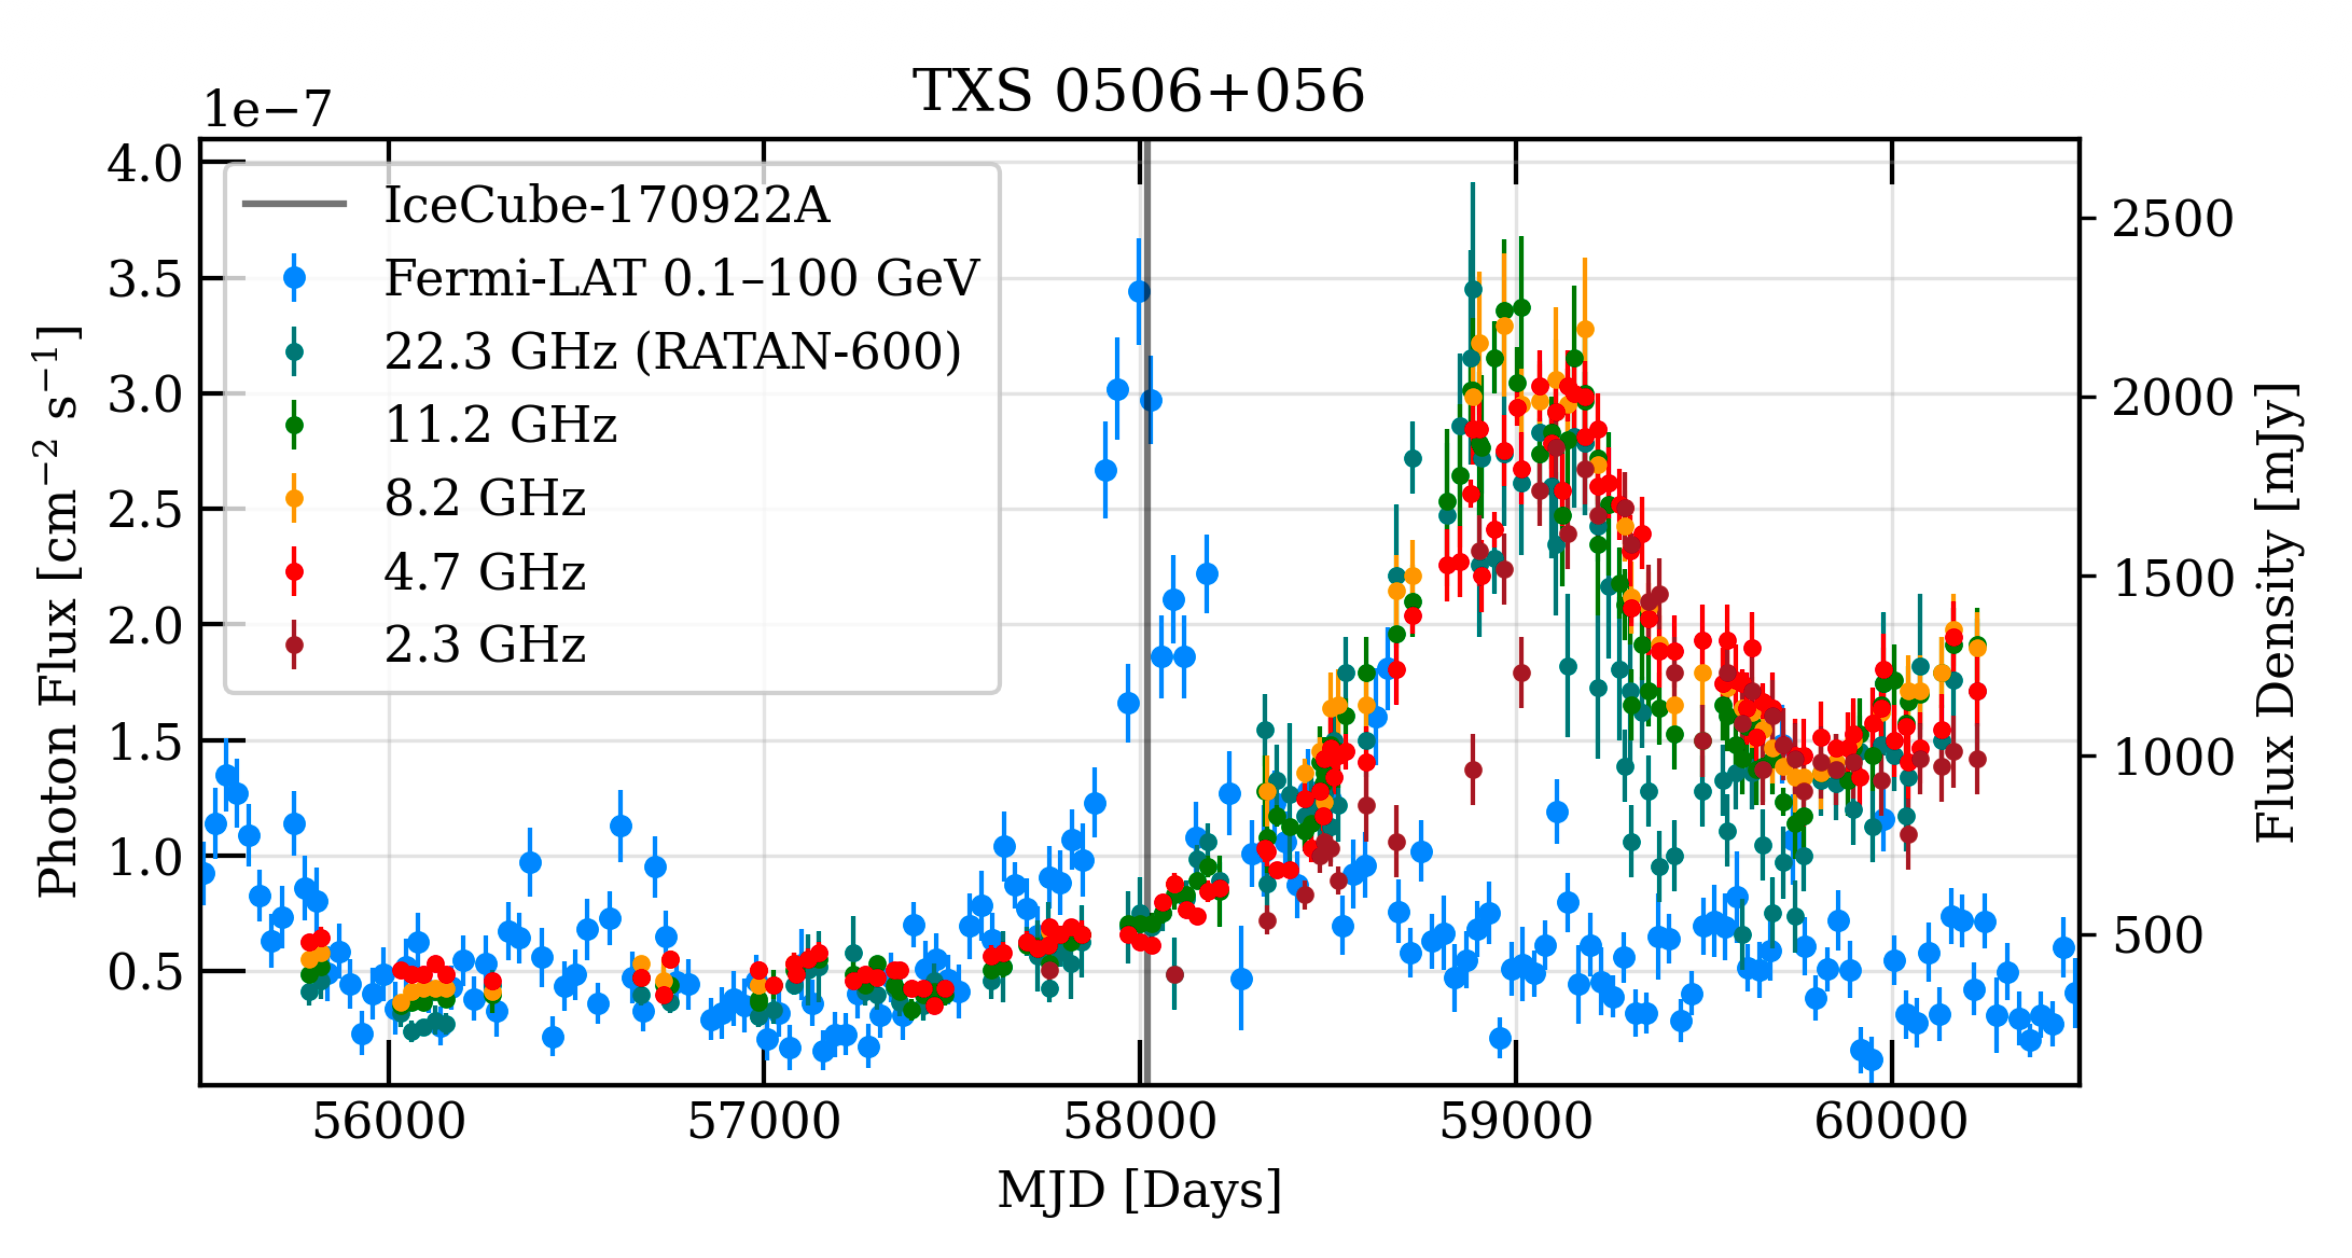
Recently, two blazars which have been associated with neutrino events have shown a longer time delay between the peak of the gamma-ray and radio flares. The light curve for one of these blazars is shown in Figure 1. This result motivates today’s authors to systematically look for longer delays between gamma-ray and radio flares in archival blazar data.
The authors utilised radio data from the RATAN-600 telescope and from the MOJAVE programme, and gamma-ray data from the Large Area Telescope on board the Fermi Gamma-ray Space Telescope.
In order to find which blazars were suitable for their analysis, they applied some selection criteria. This included:
- Setting a minimum on the number of significant data points in the light curve.
- Ensuring that the time between the first and last observation is at least 8 years.
- Checking the blazar is visible in both the gamma-ray and radio data.
- Checking there are no gaps larger than a year between data points.
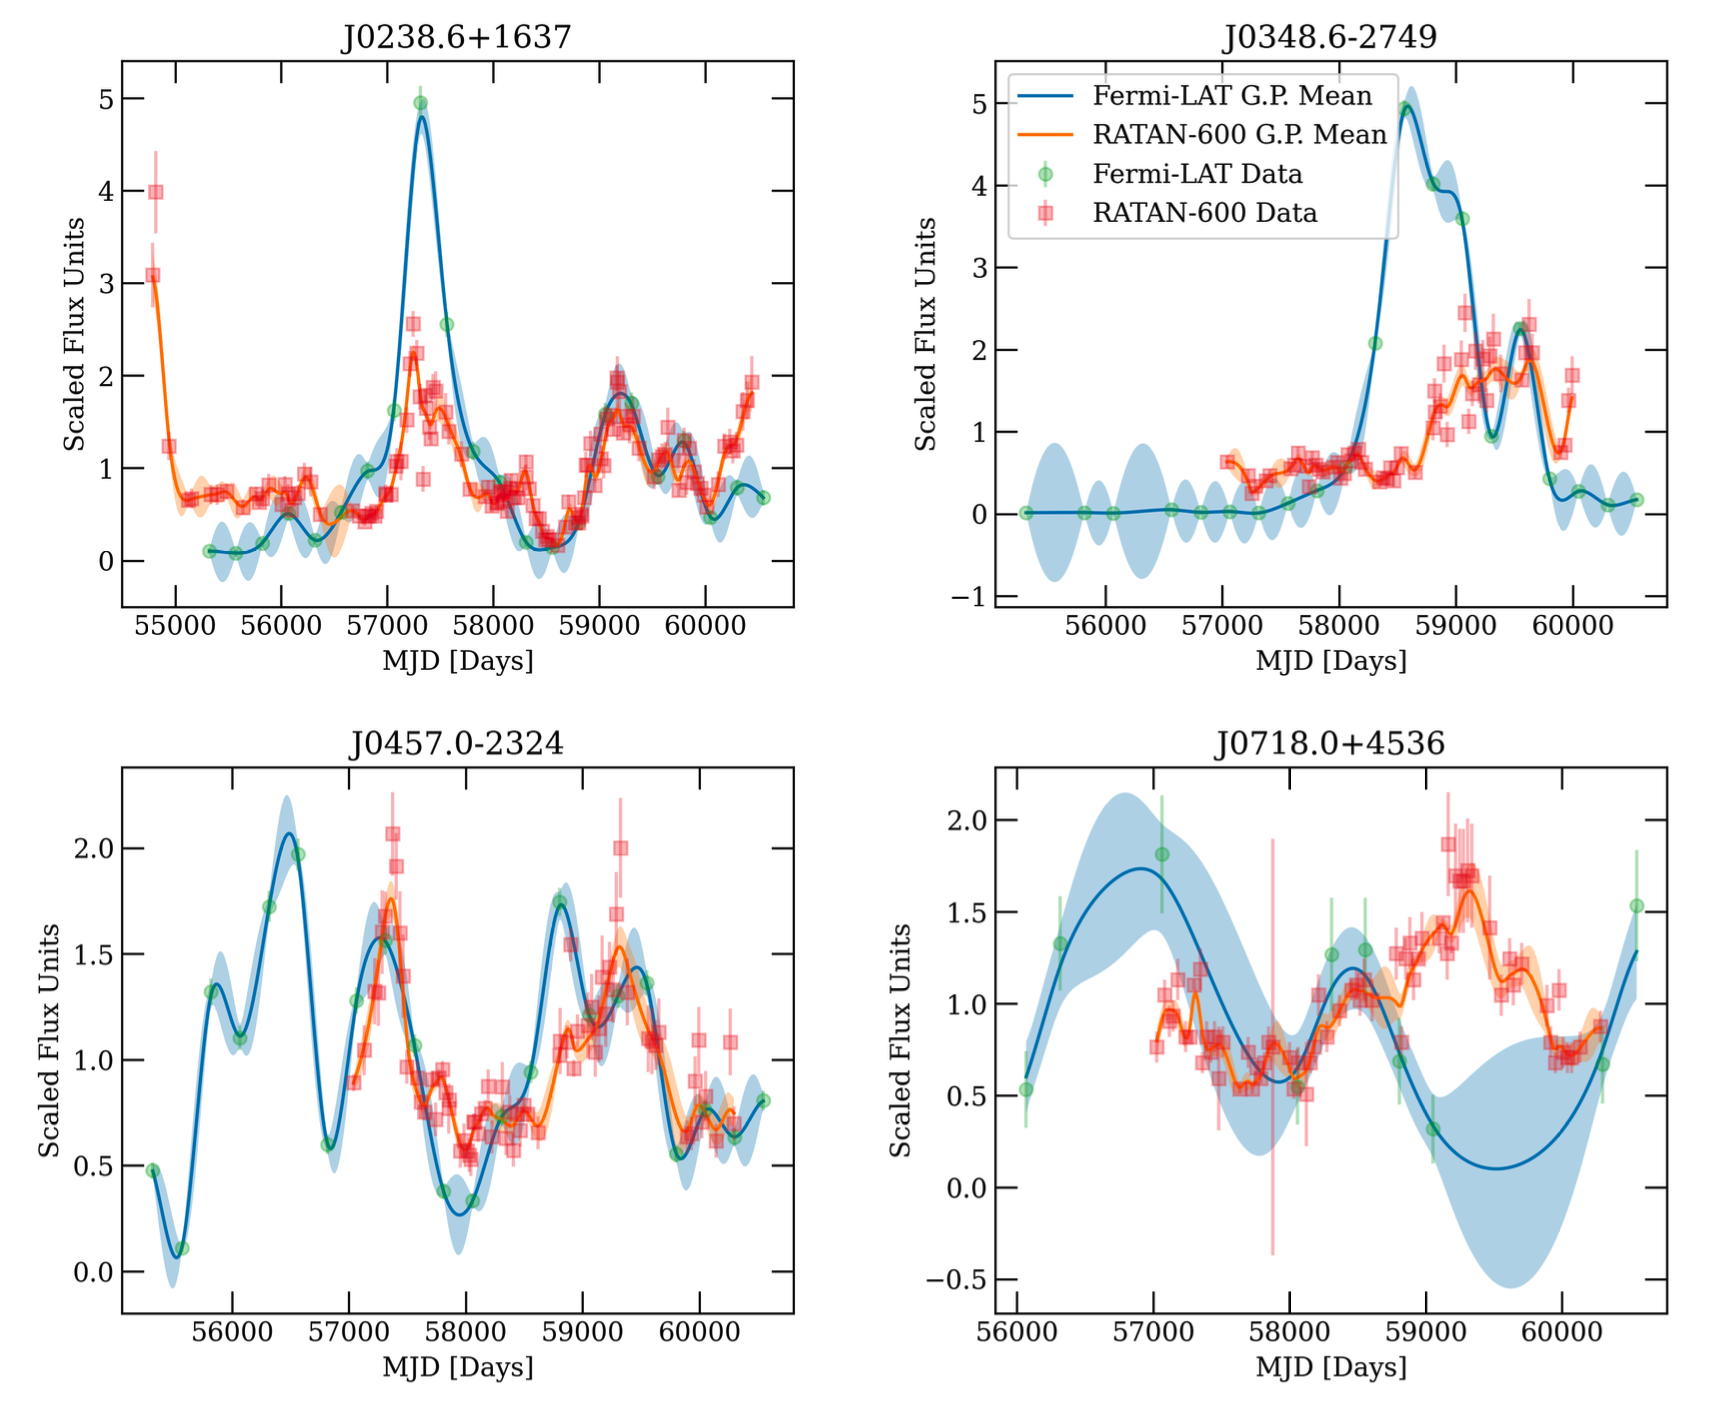
After applying their selection criteria, the authors had about 100 blazars left in their study. They then applied a technique called Gaussian Process modelling to create a smooth curve that estimates the brightness of the blazar between the known points in the light curves. You can see examples of these curves for 4 of the blazars in Figure 2.
The authors’ goal was to look for time lags between gamma-ray and radio flares. To do this, they tested how well the radio and gamma-ray light curves matched by finding the correlation between them. This is a mathematical way of checking whether changes in the gamma-ray brightness are related to changes in the radio brightness. They then shifted the radio light curve forward and backward in time by various values between -0.5 and 3.5 years and checked for a correlation again. This allowed them to test for time lags between gamma-ray and radio flares.
They discovered that more than half of the blazars they tested had a time lag of 0.5 to 3.5 years between the gamma-ray and radio flares. They concluded that rather than these flares happening at the same time or close after one another, as previously thought, there was a much longer delay for some of the blazars. As well as giving new insights into blazar physics such as jet structure and jet evolution, this work also highlights the value of ongoing long-term monitoring of blazars.
Astrobite edited by Viviana Cáceres
Featured image credit: NASA, JPL-Caltech, GSFC. (Public domain.)