
Title: The exozodi spectral effect: Residual habitable zone dust may bias exoEarth characterization
Authors: Miles H. Currie, Christopher C. Stark, Eleonora Alei and Aki Roberge
First Author’s Institution: NASA Goddard Space Flight Center, Greenbelt, MD 20771, USA
Status: accepted to the Astronomical Journal [open access]
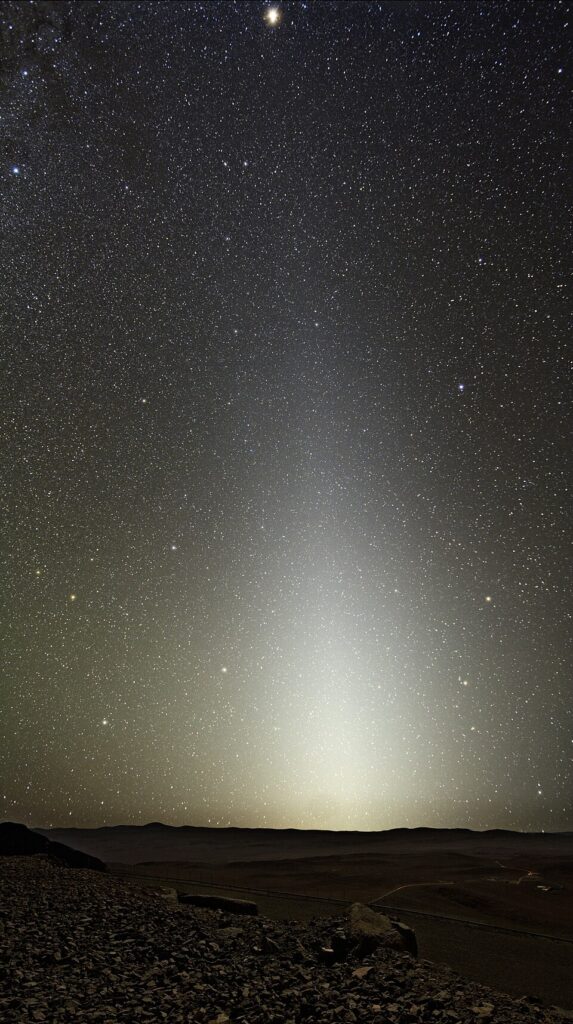
We have dust in our Solar System. A huge cloud of it that permeates every corner. The dust itself is thought to be the product of many different processes including comet tails, collisions between asteroids, leftover debris from planetary formation and gravitational collisions induced by planets. It’s small (on the order of 10–100 μm), made up of different silicates, and creates a noticeable triangle-shaped light that can be seen on the darkest nights (see Fig.1). This zodiacal dust is aptly named since the scattered light from the dust grains follows the line of the Zodiac, or the ecliptic plane, across the sky. Its structure is quite complicated, with dust rings and trails and clumps near larger planetary bodies. For more information on the Solar System’s zodiacal dust, you can read these bites here and here!
This zodiacal dust is not exclusive to the Solar System. Other star systems have been found to host similar clouds of interplanetary dust, such as Tau Ceti and Vega. This means planets imaged in these systems will also have emission from this dust mixed into the light that we observe from them. The Habitable Worlds Observatory (HWO) is a future space telescope mission under development by NASA. One of its primary science goals is to directly image 25 Earth-like planets in the habitable zones (HZ) of nearby (~25 pc) stars and look for signs of life (or biosignatures) in their atmospheres. Exozodiacal dust (aka exozodi) represents the biggest source of astrophysical noise that will need to be subtracted out from HWO observations of exoEarths. The authors of today’s paper look at the potential impact of exozodi emission on the spectra of exoEarth atmospheres.
Show me the zodi
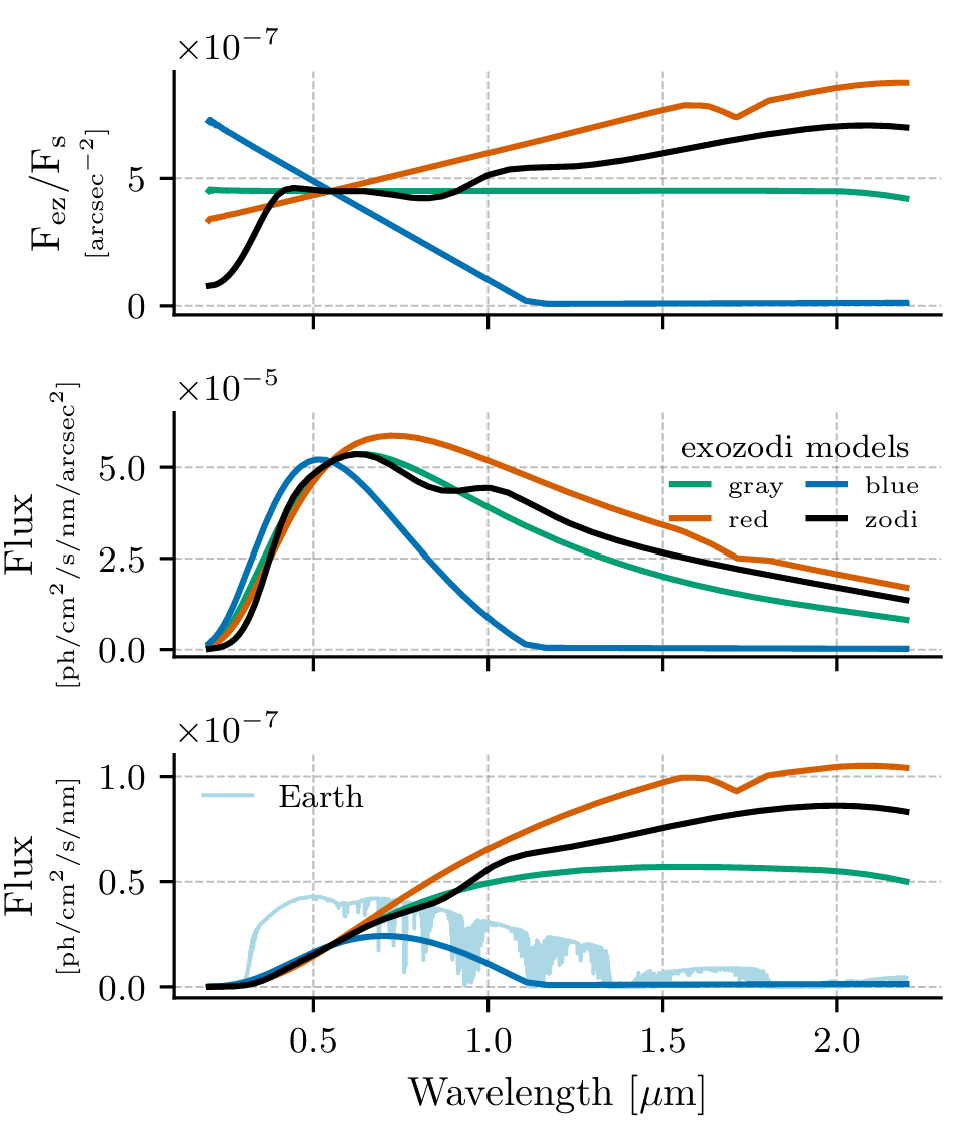
The authors first assume four different models of exozodi dust and how their emission changes over wavelength. The first model assumes a dust cloud that acts as a gray scatterer, meaning the particles scatter all wavelengths of light with no preference, and the second model acts just like the Solar System’s does. However, it’s unknown whether the composition of exozodi will be the same as the Solar System’s. Therefore, they adopt two more models of exozodi that act just like debris disks that have different compositions. One model is bluer in color because it is made up of smaller particles that preferentially scatter blue light, and the other model is redder in color because it is made up of bigger dust particles or different chemical compositions. Each of these models over HWO’s wavelength range can be seen in Figure 2. The authors then simulate a modern Earth atmosphere (both clear and 50% cloudy) as well as an Archean Earth atmosphere to understand how different exozodi models will affect observations of different exoplanet atmosphere conditions and compositions.
There’s dust in my spectra
In general, the effect that zodiacal dust has on the spectra of Earth-like planets can be broken down into two categories: its effect on the continuum and on the spectral features. The continuum is the light emitted over all wavelengths for an object that’s unbroken by spectral features. Spectral features are absorption and emission lines. These create either a dip or peak in the spectra where atoms have either absorbed or re-emitted light at that particular wavelength. Lines at specific wavelengths tell us that a certain material is there, providing a list of possible chemicals that could be present in the planet’s atmosphere. For a brief summary of spectroscopy more generally, see here.
In the case of the continuum, exozodiacal emission raises the continuum, meaning the base flux of the planet is raised and absorption lines become more shallow. These effects can be seen in Figure 3, where the authors’ simulated spectra are plotted with and without zodiacal dust included. Not only is the continuum elevated for all models including zodiacal dust, notice how the dips become shallower at longer wavelengths. Because dust primarily irradiates in thermal emission, the red debris disk model nearly smoothes out all dips beyond 1.25 microns! Molecules that absorb at these longer wavelengths, such as water or methane, may not be correctly identified with this type of exozodiacal emission.
Additionally, the slope of the spectra between 0.25 and 0.75 microns (called the Rayleigh scattering slope) becomes shallower with zodiacal dust emission, and may bias our models to lower molecular weight atmospheres. The slope at these wavelengths is dependent on the size distribution of molecules in the atmosphere, meaning it can tell us how much the average molecule in an atmosphere weighs.
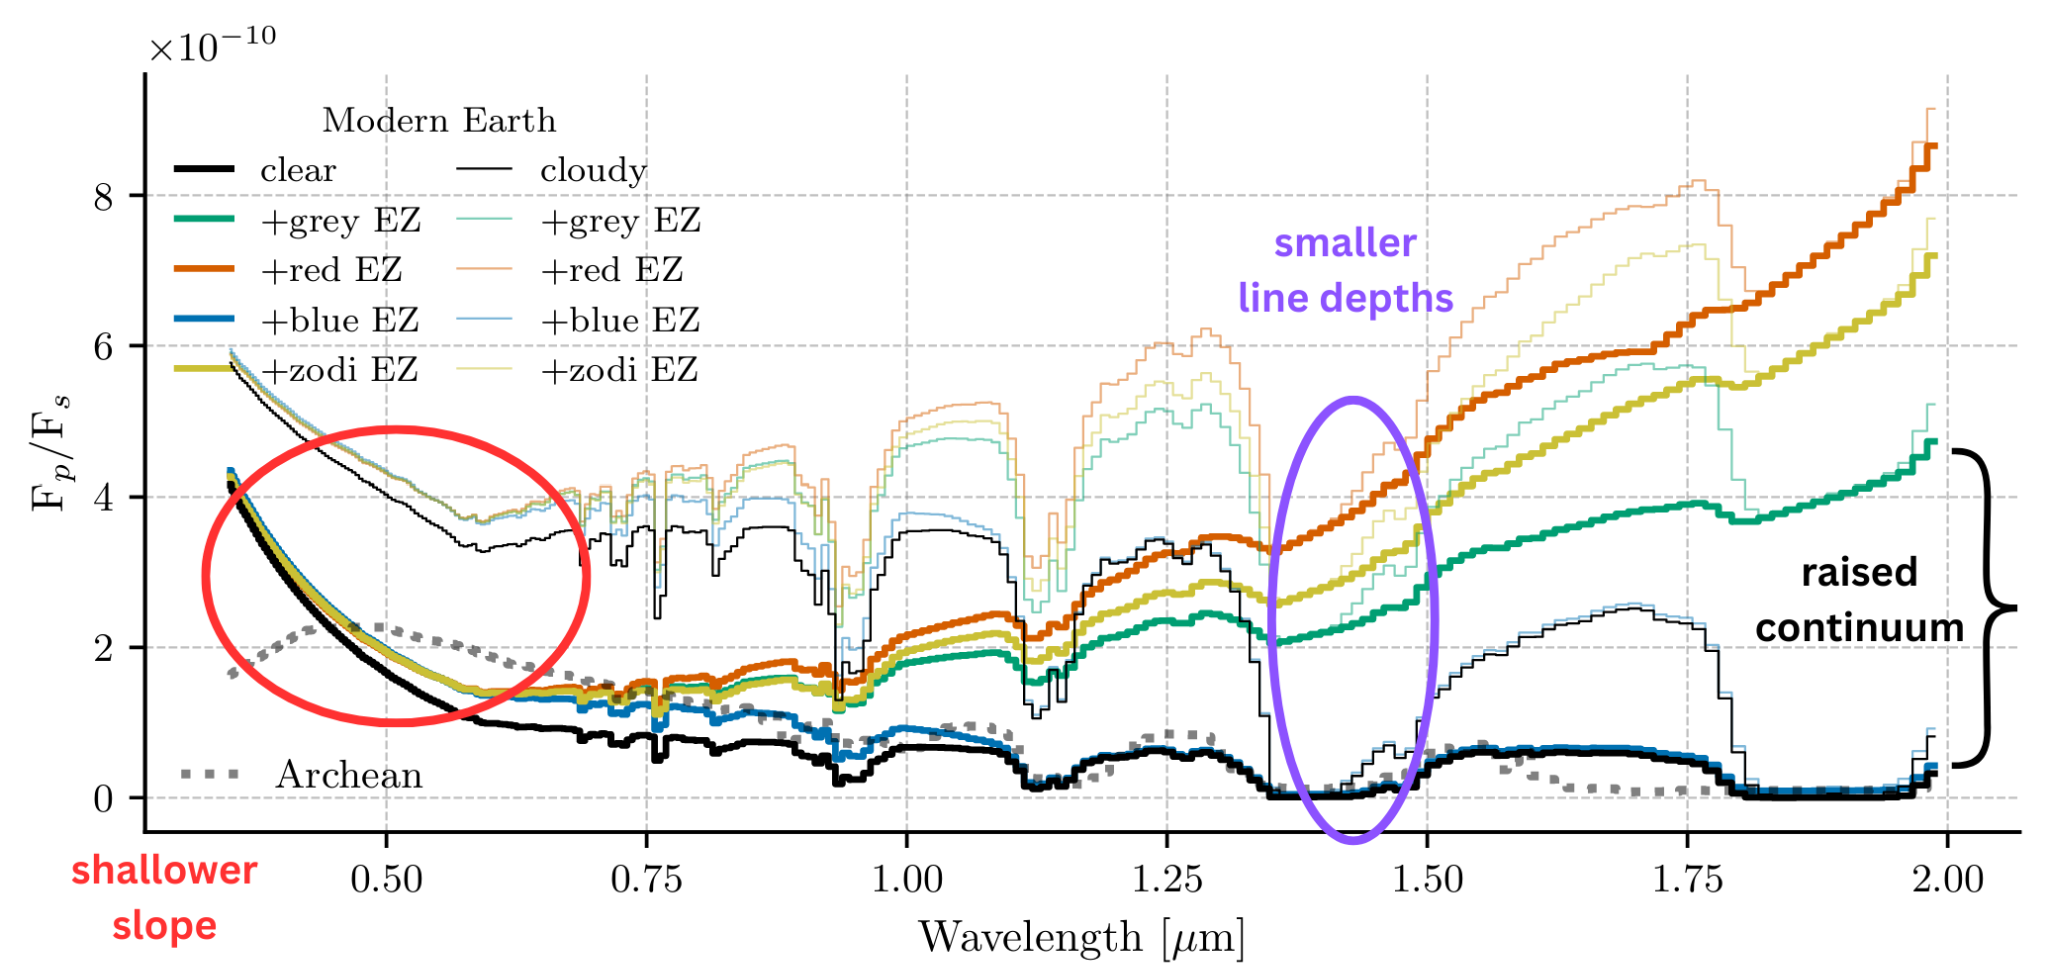
From Figure 3, the effects of zodiacal dust are minimized with a bluer zodiacal dust model. This means systems with ‘bluer’ zodiacal dust may be more optimal for HWO observations, as bluer dust does not scatter as much starlight as gray, Solar System-like, or red dust. From their results, the authors recommend that the residual exozodi-to-planet flux ratio (in the V band wavelengths) be kept to less than 10-2 in order to correctly understand the line depths (identify if a molecule is present or not) and 10-3 in order to accurately retrieve molecular abundances (understand how much of a molecule is present in the atmosphere). Dust is pesky enough here on Earth but to find life on another planet like ours, we’ll dust have to deal with it.
Astrobite edited by Anavi Uppal
Featured image credit: Keys Photography/TripofaLifestyle.com
