Title: Thermonuclear diversity and the Hubble tension
Author(s): Richard S. Miller
First Author’s Institution: Johns Hopkins University Applied Physics Laboratory, 11100 Johns Hopkins Road, Laurel, Maryland 20723, USA
Status: Published in Phys. Rev. D [open access]

Type Ia Supernovae as cosmological tools
Type Ia supernovae (SNeIa) may be one of the most famous flavors of stellar deaths, responsible for our measurement of the accelerating expansion of the universe and the existence of dark energy, for which the Nobel Prize in Physics was awarded in 2011. The Type-Ia is broadly considered a “standardizable candle,” which means that if we identify a new explosion in the sky as a Type-Ia, we can state its intrinsic brightness (or absolute magnitude) with confidence. By comparing this luminosity with our measured brightness (relative magnitude), we can calculate its distance. By also collecting a spectrum, we can measure the cosmological redshift, an effect in which the universe’s expansion rate causes objects to appear to move away from us more rapidly with increasing distance, shifting emission and absorption lines to redder wavelengths than if the object were standing still relative to us.
By combining the measurement of redshift with the absolute distance to the object, we can directly calculate the universe’s expansion rate, called the Hubble-Lemaître law. The constant of proportionality between an object’s distance and its apparent velocity is called the Hubble parameter and has been measured at approximately 67-73 kilometers/second/mega-parsec (km/s/Mpc) via various techniques. At first glance, this seems like an obtuse unit, but it can be conceptualized as follows: for every one million parsecs (3.26 million light-years) that an object is located away from us, it appears to move away from us at about 70 km/s faster due to the universe’s expansion.
The universe’s expansion can be measured in other ways as well. Most notably, we can infer the expansion rate of the universe by observing the cosmic microwave background (CMB), radiation originating from the very edge of the observable universe at redshifts exceeding 1100, or only 380,000 years after the Big Bang, compared to the 13.8-billion-year-old universe. When the Planck satellite observed the CMB in the “early-time universe”, they found a value of 67.4+/-0.5 km/s/Mpc, in a 5σ “tension” with measurements from the “late-time universe,” like SNeIa (redshifts usually not greater than z~few), where the inferred value is higher at 73.4+/-1.1 km/s/Mpc. Other measurements of the CMB and of various SNeIa catalogs have confirmed this “Hubble tension.” In today’s paper, we consider how diversity among SNeIa might resolve “one of the key outstanding mysteries of modern cosmology.”
The problem (or solution?) of thermonuclear diversity
Many mysteries remain about the origin of SNeIa. The defining characteristic is the rapid unmaking of a white dwarf (WD) via a thermonuclear explosion (fusion) once its combined mass exceeds the key theoretical maximum of 1.41 solar masses, known as the Chandrasekhar limit. At this point, gravity overcomes the electron degeneracy pressure (electrons are fermions, so via the Pauli exclusion principle, no two can occupy the same energy and location state) that was previously holding up the WD. The WD becomes a degenerate electron gas and is free to rapidly compress, igniting fusion that produces a Type Ia supernova and destroying the WD, leaving no remnant behind. This uniformity in mass (and therefore the energy budget of the supernova) leads us to believe that most events are comparable.
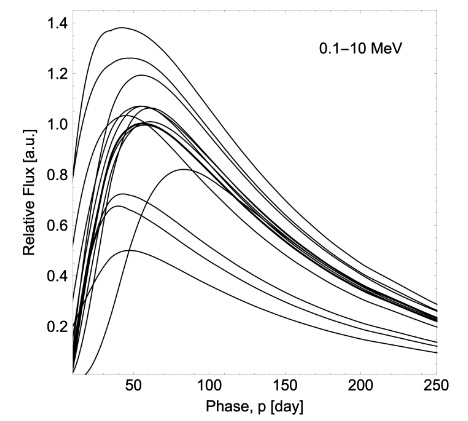
However, differences in the WD’s detailed explosion process, mass, internal structure, and composition are predicted to modify the emergent light curves; see Figure 1, which displays gamma-ray light curves from many representative SNeIa models. Unfortunately, only one Type Ia has been observed to emit gamma rays, so we typically discover and observe SNeIa through their optical emission. These high-energy photons arise from the radioactive decay of the unstable isotope Nickel-56, produced by silicon burning in the explosion, which first decays to Cobalt-56 and then to Iron-56 (over 90% of the iron we find on Earth). The high-energy photons are trapped in the ejected material, which heats it until the photons are re-radiated in the optical (called reprocessing), producing the several-month-long flashes in the night that we observe as SNeIa. This reprocessing of the intrinsic emission–already dependent on how exactly material is distributed throughout the WD–adds another layer of uncertainty and information loss.
To demonstrate how initial conditions could change the explosion, let’s consider two possible origins of producing a super-Chandrasekhar mass WD:
- “Single-degenerate”: In the first scenario, a WD is in a binary with an aging secondary star that is expanding. Once the secondary gets large enough, material on the surface feels the gravitational pull from the WD more strongly than that of its own mass, undergoing Roche lobe overflow as material is accreted onto the WD. Eventually, the WD accumulates enough material to exceed the Chandrasekhar limit and explode. If all SNeIa take this pathway, the initial mass of the exploding WD is conveniently always just above the limit. Unfortunately, this scenario is relatively rare, accounting for no more than 20% of observed SNeIa.
- “Double-degenerate”: In scenario two, consider a different binary that has two WDs. Over time, they inspiral by losing orbital energy to gravitational waves, eventually coalescing into an object exceeding the Chandrasekhar limit and exploding. In this scenario, the initial mass of the exploding object and its exact distribution can vary widely, depending on the precise masses of the two merging WDs.
The impact on cosmology
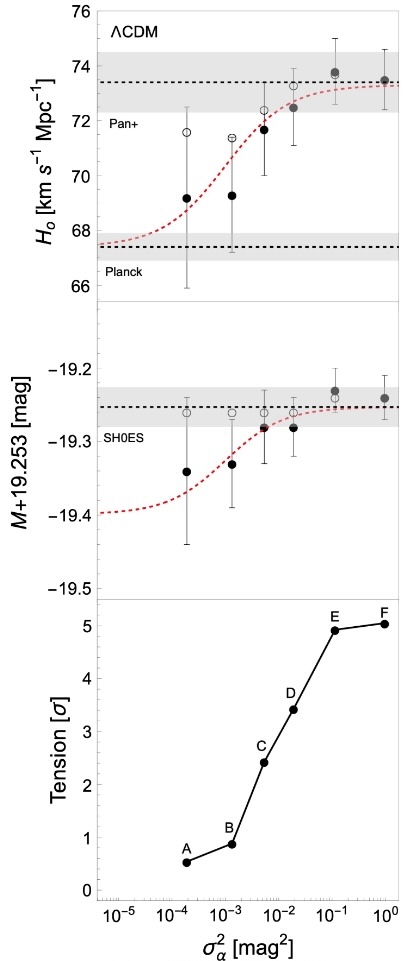
Today’s paper quantifies how differences in the light curves of SNeIa contribute to inferred cosmological parameters, with a focus on the Hubble constant. Today’s paper uses the Pantheon+ SNeIa dataset, which contains 1701 light curves from 1550 unique events with redshifts up to z ≤ 2.26. Each SNe light curve shape is “standardized” by fitting to an average Type-Ia light curve modified by an amplitude (peak magnitude), light curve stretch (shorter or longer durations), and “color (a parameter to handle variation in wavelength). The remaining scatter in the light curves after standardization has a variance as significant as 0.966 mag2, suggesting light curve shape-dependent diversity that is indicative of a non-standard candle population. When fitting the Hubble parameter to the redshifts and distances of SNeIa, the 5σ tension is recovered (see Figure 2, Subset F).
To determine how this significant variance changes the measured Hubble parameter, the SNeIa sample was grouped into six smaller subsets, A through F; subsample A contains lightcurves that are all very similar to each other, and therefore has the lowest variance. Each subsequent subsample includes more and more lightcurves, gradually increasing the variance in magnitudes, until reaching subsample F, which contains all of the lightcurves. Re-deriving the Hubble parameter with a more homogeneous sample reveals that the tension has been alleviated and is in better agreement with the early-universe value. Figure 2 shows that the tension rises as SNeIa sample heterogeneity increases.

Since Subset-A includes only the “middle 2%” of the most average light curves, additional similar subsets can be constructed by slicing out other similar groups of SNeIa at further deviation from the average light curve, with the downside that the further from the average light curve, there are fewer SNeIa to select, causing the individual subset size to be smaller. By building six “diversity mitigated” samples and then re-fitting for the Hubble parameter for each sample individually and combining the results to get 67.9+/-0.8 km/s/Mpc, the Hubble tension is reduced from 5σ to 0.5σ, a 90% tension reduction! Figure 3 displays the new value compared to other samples and its agreement with the Planck value. This work indicates that diversity-driven systematics in fitting SNeIa light curves may nearly fully explain the Hubble tension, suggesting that invoking new cosmological models is unnecessary to explain the observations.
Future work is promising to confirm this effect. Since slicing the data into similar SNeIa and analyzing independently reduces systematics at the cost of increasing statistical error, an extensive sample of SNeIa could mitigate remaining uncertainties in the Hubble parameter. The Vera C. Rubin Observatory, located in Chile, is now coming online and preparing for a 10-year all-sky monitoring mission that will detect more than 10,000 SNeIa per year. As these data become available, verification of the role of SNeIa heterogeneity in the inferred cosmological parameters will become more robust.
Edited by Nathalie Korhonen Cuestas