Title: The Dark Energy Survey: Cosmology Results With ∼ 1500 New High – redshift Type Ia Supernovae Using The Full 5-year Dataset
Authors: DES Collaboration: T. M. C. Abbott, M. Acevedo, M. Aguena et al
First author institution: The Cerro Tololo Inter-American Observatory, La Serena, Chile
Status: submitted to The Astrophysical Journal (ApJ), arXiv
The Dark Energy Survey (DES) Collaboration is an international team of scientists that aims to measure and understand the nature of an elusive energy density component in the Universe, Dark Energy. The DES survey was conducted using the 4 metre Blanco Telescope at the Cerro Tololo Inter-American Observatory in Chile, and took observations from 2013-2019. The survey used a special camera, called DECam. DECam has a wide-field-of-view (about 14 times the size of the moon in the sky), allowing for detection of galaxies over a large sky area. It also allows for sensitive measurements of the redshifted light from these galaxies with a 570-megapixel camera with 74 CCDs with minimal ‘readout noise’ in the measurements. This paper specifically focuses on the results of the DES supernova survey (more about their other survey data can be seen here), which was designed to test cosmology with a large sample of supernovae observations.
In 1998, two teams of scientists measuring the brightness of supernovae unexpectedly discovered anomalously faint supernovae at specific times in the earlier Universe, indicating that the Universe is accelerating in its expansion (they got a Nobel Prize for this discovery). Before 1998, cosmologists believed in three possibilities for future expansion of the Universe. These were that it would either stop and reverse (resulting in a collapse), it would come to a halt (resulting in a static Universe), or that it would reach a constant expansion rate – as they assumed the Universe only consisted of matter being influenced by gravity and radiation.
The discovery of an accelerating expansion changed this. Type Ia Sne have a standard brightness, which allows us to determine their distance based on how faint they look in a telescope. We can also measure the redshift of supernovae from spectra, which can be compared to predictions from cosmological models that relate the redshifting of the light to the Universe’s expansion rate over time and how far the light has travelled. Thus, we can plot the observed redshifts of the Sne against their distance (from the measurements of their brightness). This plot is known as a Hubble diagram and can be used to fit a cosmological model. In today’s paper, the DES Collaboration has done exactly this to test cosmological models. This time however, instead of only 52 Supernovae that the discoverers of dark energy had in 1998, there are 1635 in the DES 5-year dataset – over 30 times more!

Lighting the way with the Universe’s candles
The 1635 supernovae found and used by DES (after quality cuts) cover redshifts greater than z~0.1 so 194 Type Ia Sne from samples external to DES are included in the data analysis to cover low redshifts (see Figure 1). In total, this resulted in an analysis of 1829 Sne. Part of the cuts to the data involved removing Sne contaminants – transients that look like Sne Ia, but might actually be something else. In order to distinguish the Type Ia Sne and contaminants, two machine learning classifiers were used; they were trained on simulated Type Ia Sne or a Type II (core collapse) light curves (see more about different supernova classification in this bite and Type Ia light curves here). Sne can be classified using spectroscopy, but in the DES analysis the machine learning classifies them using multi-band photometry. This is akin to low-resolution spectroscopy, as the flux from the Sne is measured in a few different filters, instead of many different wavelengths. This approach allowed DES to observe many more Sne than before in their survey. The classifiers gave the Sne a probability of being a Type Ia, as shown in Figure 1 above, and these probabilities were used as weights in the model fitting analysis. To remove human bias in the analysis, the pipelines used were tested on blinded data – that is, the data was made to look different deliberately. This allows for one to ensure the pipeline works well and that those completing the analysis do not introduce bias towards an expected result.
Hints of time-varying dark energy?
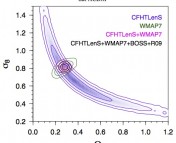
In the standard model of cosmology, 
The tests on the DES data alone and with combinations of external data for standard

 , and dark energy equation of state parameters, for the
  CDM model. The different coloured contours and likelihoods represent the different data combinations indicated by the legend.
However, the story changes slightly for the time-varying dark energy models. In the first, 


There is a marginal preference for a time-varying equation of state as shown by the results above – the data prefers this over a model with a cosmological constant with ~95% confidence – just over 2σ. The best fits from the combination of Planck, DES and eBOSS find 


While we can’t confidently state from these results that dark energy must be time varying, these results here could be a hint at new physics to be discovered by cosmology in the future – but only further analysis and data can tell.
Edited by Kylee Carden
Featured image: Cerro Tololo Inter-American Observatory, CCA BY 4.0, https://commons.wikimedia.org/wiki/File:Cerro_Tololo_Inter-American_Observatory_(CTIO_20120706_Panorama_Tololo_2_DMunizaga-CC).jpg via Wikimedia Commons
.jpg)