Title: Measuring the Hubble constant with Type Ia supernovae as near-infrared standard candles
Authors: S. Dhawan, S.W. Jha and B. Leibundgut
First Author’s Institution: Oskar Klein Centre, Department of Physics, Stockholm University, Sweden
Status: Astronomy & Astrophysics (open access)
Astrobites coverage so far on the Hubble Constant (H0) measurements and the supposed ‘tension’ between various probes:
- Conflicts between Expansion History of the Local and Distant Universe
- The Trouble with H0
- The Hubble Constants
For a treatment of distance measures in cosmology, the relationship between luminosity distance and the Hubble Constant H0, and the cosmic distance ladder, see here and here.
The field of precision cosmology is at a fascinating juncture, as elaborated in Astrobites’ reporting of the subject in the last few months. Various measurements of H0 – the expansion rate of the universe – are at disagreements with each other. In the tale of performing H0 measurements with a variety of probes, today’s bite touches upon the local and ‘direct’ measurements of H0 from supernovae i.e. exploding stars!
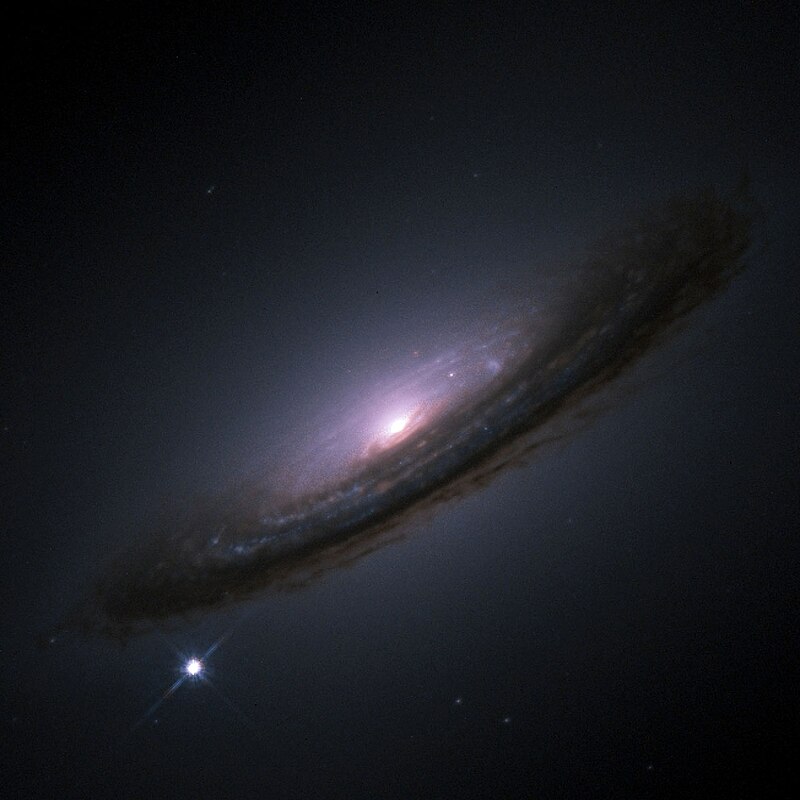
Fig 1. SN 1994D (lower left), a Type Ia supernova in all its glory, accompanying its host galaxy NGC 4526 (Photo Credit: NASA/ESA – HST)
Supernovae and the distance ladder
Supernovae are a crucial component of the cosmic distance ladder. Astrophysicists use direct measurements of nearby objects (e.g. stars) to quantify distances of intermediate objects, to quantify distances of intermediate objects (e.g. variable stars like RR Lyrae and Cepheid variables), to quantify distances to far-away objects, and so on. One of the highest rungs in this ladder are Type Ia supernovae (SNe). These supernovae (SNe) form from a fixed known mechanism (a binary white dwarf star accreting matter from a companion star and exploding at a fixed mass and ‘brightness’), which makes them reliable distance indicators. We know what brightness to expect from these SNe if they exploded next door, and their actual observed brightness shall tell us exactly how far they are! This is called being a standard candle. Type Ia SNe are standard candles. Well, sort of.

Fig 2. Supernovae light curves – magnitude vs time. B band light curves have a single peak magnitude, while J band light curves have two. (Credit: Swinburne Astronomy/COSMOS)
Photometrically, most work done in the field of supernova cosmology revolves around taking images of SNe in ‘optical’ wavelength bands (e.g. B, V filters) over time. Plotting absolute magnitudes (or luminosity/ intrinsic brightness) of an observed Type Ia supernova vs time in different wavelength ranges looks something like Fig 2 (Going redder as we go up in the light curve plot). It can be seen that observing Type Ia SNe in bluer bands like B (~4500 Angstroms) generally shows one luminosity peak, while looking in redder bands like J (~12000 Angstroms), we see two peaks.
Keeping this in mind, it is important to discuss the various caveats that go into performing distance measurements via SNe:
- It is generally observed that B band peak luminosities vary much more from supernova to supernova than J band peak luminosities. This ‘scatter’ subsequently propagates as systematic uncertainty that directly affects cosmology measurements i.e. our constraints on H0.
- Also, B band peak luminosities suffer from more reddening than J band peak luminosities i.e. more of their blue light gets scattered. This is another systematic!
- Phillips’s relation – the relationship between the peak luminosity and the width of the peak in Type Ia SNe – is a bigger source of uncertainty in B band peak luminosities than J band peak luminosities.
This is where today’s paper comes into the picture.
This work : Supernovae as near-infrared standard candles
Dhawan et al. suggest using J band peak magnitudes (or magnitudes from other near-infrared wavelength bands) to quantify distances to these SNe (see a treatment of luminosity distances and H0 in the links at the beginning). Due to lower intrinsic systematics in J band peak magnitudes, a supernova in near-infrared (J, H) could potentially act as more standard of a candle than in the optical (B, V). This implies that near-infrared light curves could complement or even improve the H0 measurements, using Type Ia SNe as near-infrared standard candles.
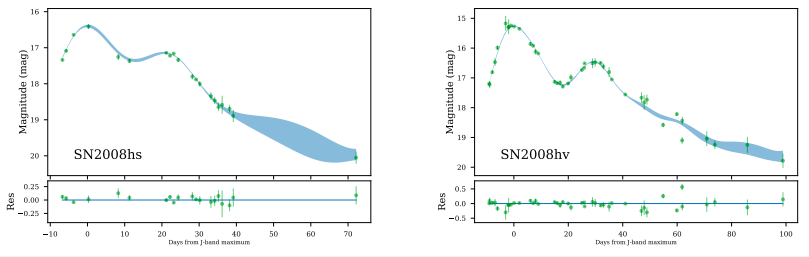
Fig 3. Two Type Ia Supernovae light curves in J-band – magnitudes vs time – used in this work. The plots below reflect the uncertainties. 27 SNe and their fitted light curves were used to calculate J-band peak magnitudes. (Figure A2 of Dhawan et al.)
This paper employs 9 Type Ia SNe as calibrators (their luminosity distances are already well known), and uses their near-infrared light curves to estimate luminosity distances to 27 other SNe. This work, as mentioned above, assumes the SNe are standard candles in their J-band peak magnitudes. These peaks are calculated using a technique called Gaussian process interpolation fit (see Fig 3). The simplicity of this paper’s approach lies in the fact that this work does not make any standard corrections to these peak magnitudes. What’s special about that, you ask? The beauty here is that unlike the analysis involving optical (B-band) peak magnitudes, this analysis does not correct for light-curve shape (Phillips’ relation!) or reddening (scattering!). Then, the peak magnitudes are directly used to calculate the distances to these SNe (via fitting a Bayesian model to the total data set and performing an MCMC sampling of the posterior distribution). You must wonder – with these assumptions, how good would the luminosity distance (and H0) calculations be?
This work finds that the median H0 = 72.78 +1.6 -1.57 km s-1 Mpc-1 (Fig 4). This implies a 2.2% uncertainty that is in good agreement with median values and uncertainties from SNe analyses involving optical peak magnitudes! Moreover, it is also seen that tweaking the SNe sample – using only the farthest SNe, or only using SNe from a specific survey which would have their own systematics – changes the H0 value by 1-2% at most. These, and several other `extensive cross-checks’ in this work establish that J-band peak magnitudes can be used as robust estimators of H0, and are valuable rungs on the cosmic distance ladder. Moreover, the consistency between H0 values from near-infrared and optical peak magnitudes in SNe (and a slight difference from the CMB value of H0) demonstrates that ‘wavelength-dependent systematic uncertainties’ – reddening and light-curve shape – may not be majorly responsible for the tension between SNe and CMB measurements of H0.
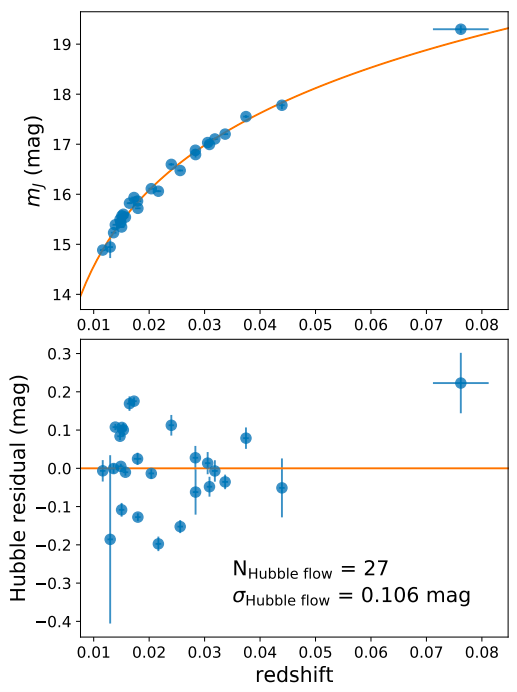
Fig 4. The Hubble Diagram (top), containing the 27 Type IA SNe used in this work. This gives a median H0 value consistent with other SNe estimates, as well as an H0 uncertainty comparable to other work (bottom). (Figure 3 of Dhawan et al.)
What next for Supernova Cosmology?
Dhawan et al. have hinted at the efficacy of using SNe as near-infrared standard candles over SNe as optical standard candles with systematic corrections, and have obtained comparable values of H0. Expanding this sample to a higher number of SNe, as well as using H-band light curves to further constrain luminosity distances will certainly improve this analysis in time to come. As the Astrobites linked above have repeatedly mentioned, the field of making precise measurements of the expansion rate of the universe is just getting into its groove, with new surveys, new probes and new methodologies, just like today’s paper. Watching this space might just be worth your time!
Author