- Title: A New Method For Galaxy Cluster Detection I: The Algorithm
- Authors: Michael D. Gladders, H.K.C. Yee
- First Authors’ Institution: University of Toronto
Introduction
In this post, I’d like to discuss a slightly older paper. It’s worth discussing, though, because in the process we can learn a lot about galaxy cluster science. It’s also not every day that someone comes up with a new method for finding galaxy clusters, which is what this paper is all about. The method described by this paper is still relatively young, and any new detection method can help fill gaps left by our other methods.
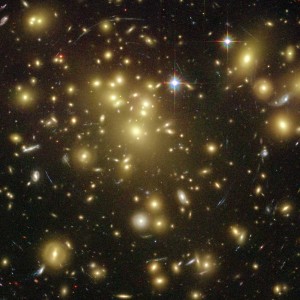
The rich cluster Abell 1689. Abell found it first, so he got to name it. Note the gravitationally-lensed images of galaxies (the light blue streaks), indicating a high concentration of mass. Image from the Hubble Space Telescope.
Think about it: how would you find a galaxy cluster? It isn’t necessarily easy. The Virgo Cluster is the largest nearby cluster, but it’s roughly 50 million light years away, and its central core only spans about 7 square degrees of the sky. Since the Virgo Cluster is in our cosmic back yard, any other clusters we hope to detect will appear even smaller. You might think the best idea is just to observe a large part of the sky, divide it up into regions of fixed size, and then count how many galaxies you see per region. Regions with a high number density would then likely be clusters.
In fact, that’s exactly what George Abell did in order to compose the historic Abell catalog of galaxy clusters: he pored over a stack of photographs from the Palomar Observatory with a magnifying glass, counting galaxies by hand. It was the first cluster survey of its kind, finding over 4,000 clusters, and Abell published his data in 1958.
As you might imagine, this method can lead to a “false positive” detection if a bunch of galaxies at different distances just happen to line up on a line of sight, creating a galaxy overdensity in the sky when really they’re not part of one continuous structure (see figure 2). What we really want is a method that finds not just a visual overdensity but an overdensity in galaxies at roughly the same redshift.
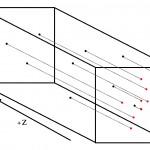
Here we see my crude illustration of the projection effect. Black dots represent galaxies. Even though they’re at vastly different distances and therefore do not form a cluster, when we observe them they appear spatially clustered (the red dots).
The Red Sequence Method
A few major cluster detection methods have been used since Abell’s time. Clusters contain a lot of hot gas, which radiates X-rays in a process known as Bremsstrahlung radiation; clusters can therefore be found thanks to their X-ray luminosity. A more exotic method uses the fact that cosmic microwave background radiation photons will be bumped to higher energies by interacting with the hot cluster gas (the Sunyaev–Zel’dovich effect).
The paper we’re looking at in this post proposed a new detection method when it was published in 2000. The method cleverly exploits the fact that galaxy clusters all contain a well-defined, highly regular population of elliptical and lenticular galaxies, known as the red sequence.
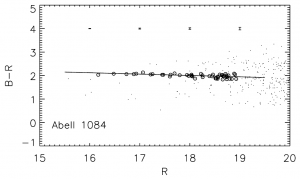
Here’s an example of a red sequence, from the cluster Abell 1084. Each point describes the color and brightness of an individual galaxy in the cluster. A clear red sequence is present (the black line). The remarkable tightness of the correlation is a general feature of all clusters, which is why a method like this can work. Figure reproduced from Stott et al. (2009).
All of these early-type (elliptical and lenticular) galaxies that fall on a cluster’s red sequence have a tight relationship between their color and magnitude. In other words, an elliptical galaxy in a given cluster with a certain color will have a specific overall brightness. You wouldn’t necessarily expect such a relationship to exist in nature: why should there be such a tight color-magnitude relation? It’s an interesting and ongoing question.
Take a look at figure 3 here, showing the red sequence that is in place in cluster Abell 1084. The axes run from bright on the left to dim on the right, and red at the top to blue at the bottom. Each point on this diagram represents the color and magnitude of a galaxy in the cluster, and the circled points are the elliptical and lenticular galaxies. There is a clear, linear relationship in this diagram for such galaxies, showing that the redder ones are brighter. Finding such a tight correlation between parameters is extremely rare in astronomy, and also extremely useful.
Every galaxy cluster observed to date contains a well-defined red sequence of galaxies. This means that we can potentially find clusters by looking for overdensities of galaxies that form a red sequence. The projection effect would no longer be a problem, because a random selection of galaxies at different redshifts will not form a coherent red sequence. The authors discuss this in detail in section 2 of the paper.
The method starts by simulating what the red sequence will look like at different redshifts. This is calibrated to match what we see in the nearby Coma cluster, as it is one of the closest and most highly-studied clusters. These simulated red sequences can be compared against what we have already observed in clusters, and since they show good agreement with observations, we can believe them.
Then you take all of the galaxies in your entire sky survey and assign to each of them a probability that they belong to a red sequence of a specific redshift. This is essentially determined by how close they are to falling exactly on the red-sequence line.
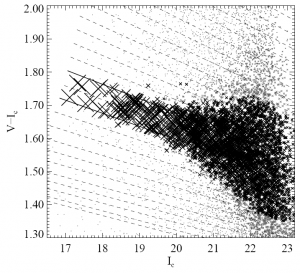
This is an example of assigning probabilities to a red sequence at a specific redshift. Each dashed line represents what we expect the red sequence to look like at farther and farther redshifts. The one we’re specifically concerned with is bracketed by the solid black lines. The size of each data point represents the probability that the given galaxy belongs to the red sequence at this redshift.
You then look at the distribution of your most likely red sequence galaxies in the sky. If a bunch of them happen to cluster in an isolated region, then congratulations! You’ve demonstrated that a compact region of the sky contains a believable population of red sequence galaxies at a specific redshift. In other words, you have a galaxy cluster candidate!
Of course, you can’t really believe your results until you go back and confirm through spectroscopic redshift measurements that yes, these galaxies all exist at roughly the same redshift and therefore occupy a compact volume in space. Nevertheless, this is a massive time-saver compared to just doing a spectroscopic survey to begin with, which generally would be prohibitively expensive and time-consuming. This is how all cluster detection surveys proceed, though, and we can also get a handle on how robust the method is by seeing if it can detect clusters we already know about.
In any case, the authors went on to use this method in their massive Red Sequence Cluster Survey, forming the RCS catalog which published 429 candidate clusters. RCS2 is currently underway. The red sequence method has also been applied in the Pan-STARRS survey, and also in the Spitzer Adaptation of the Red-Sequence Cluster Survey (SpARCS) survey. It has the potential to detect clusters at redshifts where other methods fail (the 1.5 < z < 2.2 “cluster desert” in which there is currently only one known cluster).

Awesome introduction for a student totally new to galaxy clustering !
Thanks a lot!
amazing overview !
Thank you!