Title: The red sequence at birth in the galaxy cluster ClJ1449+0856 at z=2
Authors: V. Strazzullo, E. Daddi, R. Gobat, et al.
First Author’s Institution: Ludwig-Maximilians University, Munich
Paper Status: Accepted to ApJ Letters
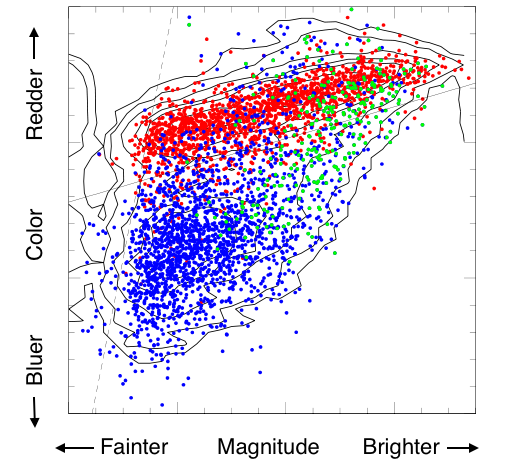
Figure 1: An example of a Color-Magnitude Diagram, using galaxies in the Sloan Great Wall (adapted from Figure 3 of Gavazzi et al. 2010). Spiral galaxies (blue points) tend to be fainter and bluer, while ellipticals (red points) lie in the relatively-tight “red sequence”.
One of the earliest discoveries about galaxies was that they are not distributed randomly in space. Just as people may live in crowded cities or in sparse rural towns, galaxies can be found in dense, compact galaxy clusters, in large diffuse voids, or in a wide variety of environments in-between. Galaxies in different environments tend to have different properties, just as the demographics of urban and rural residents often differ. Typically, clusters of galaxies tend to have more red, elliptical galaxies than voids, which are dominated by blue spirals. This is known as the density-morphology relation.
A useful way to compare galaxies is through their magnitudes (a measurement of brightness) and their colors (how red or blue?). The common tool for this study is to place many galaxies on a color-magnitude diagram (CMD). An example of such a diagram, with the many galaxies from the galaxy clusters in the Sloan Great Wall, is shown to the right (Figure 1).
A noticeable feature in a CMD (especially in galaxy clusters) is the red sequence: red, elliptical galaxies are tightly clustered in the diagram, spanning a wide range of magnitudes but a narrow range of colors. These galaxies have ceased forming new stars, and so only contain old, red stars. Hence, there is little variation in color, regardless of how bright (or massive) they are.
The authors of today’s paper use images from the Hubble Space Telescope to measure galaxy colors and magnitudes in the cluster ClJ1446 (Figure 2, below). What’s new about this work is that ClJ1446 is extremely far away: it has a redshift z=2, which means we’re seeing it as it was over 10 billion years ago!
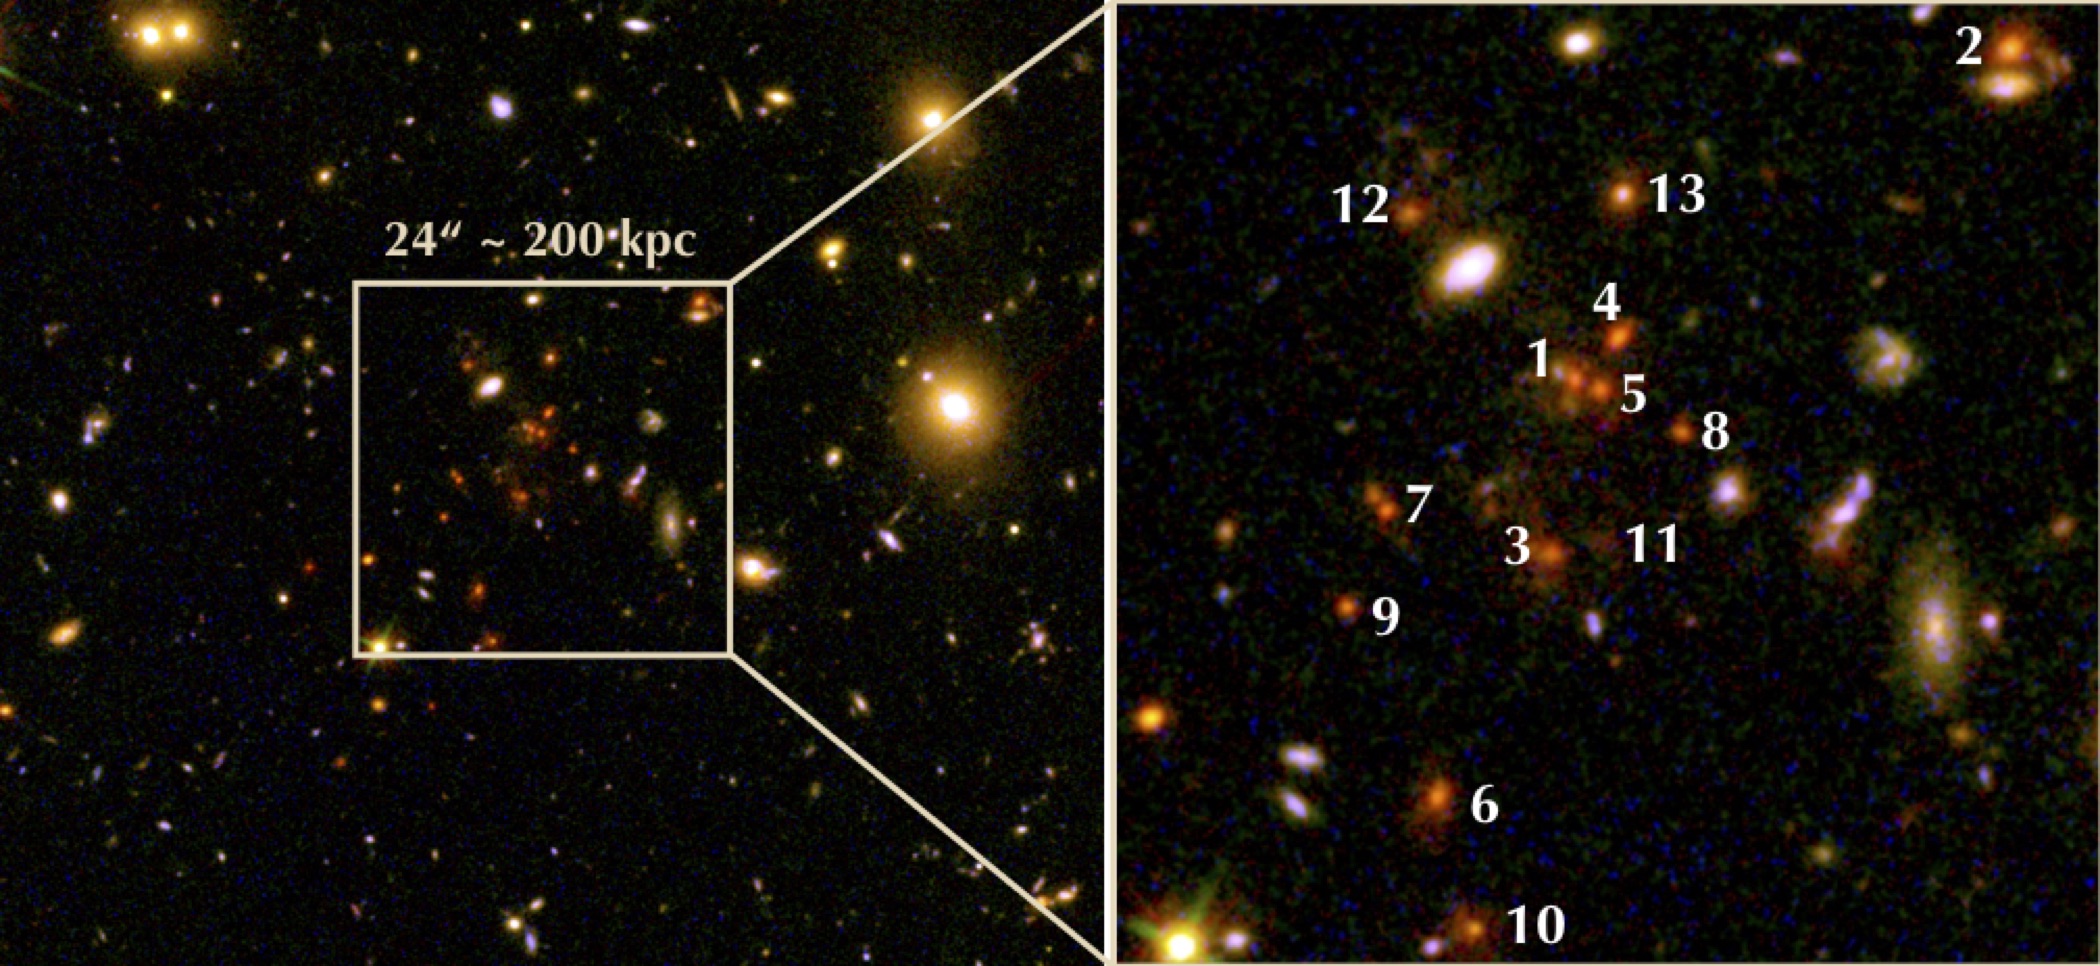
Figure 2: Hubble view of the cluster ClJ1446. The highlighted, very-red galaxies are in the distant cluster, while the rest are probably interlopers from the foreground. (Figure 1 from Strazzullo et al. 2016).
While ClJ1446 is smaller and less massive than most present-day clusters, it is probably very similar to what they looked like 10 billion years ago. Therefore, this work can help improve our understanding of how our nearby galaxy clusters likely evolved.
With the Hubble data, the authors first compared the number of red, elliptical galaxies in the center of the cluster (the urban downtown) to the outskirts around the cluster (the suburbs). They found a larger fraction of red galaxies in the center than the outskirts, strong evidence that the density-morphology relation still held 10 billion years ago.
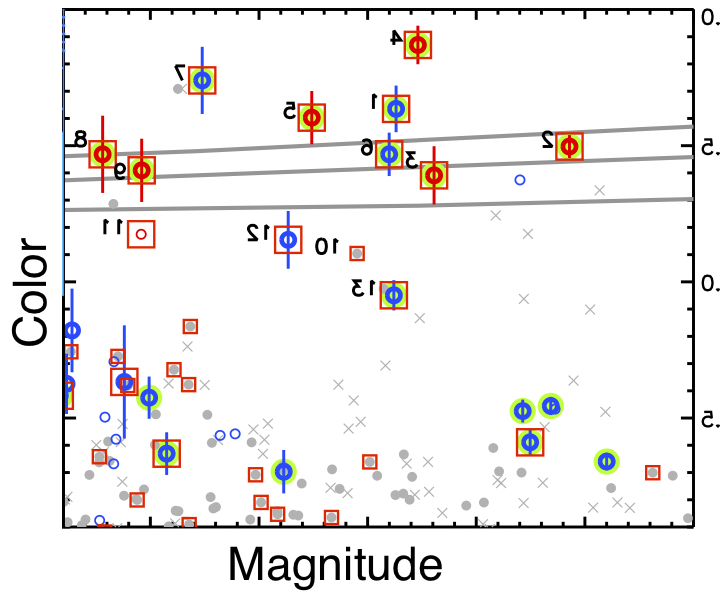
Figure 3: The Color-Magnitude Diagram from the field around the high-redshift cluster, ClJ1446. The “red sequence” of galaxies near the top of the diagram is more scattered than we see in clusters today. Grey crosses and circles are suspected foreground interlopers. (Figure 2a from Strazzullo et al. 2016)
They then constructed a CMD of the galaxies in the distant cluster (Figure 3, to left). All clusters from redshift z=1 to today have tight red sequences, similar to Figure 1, above. But these observations show that this isn’t the case for this early cluster at redshift z=2, whose red sequence is about twice as wide as in most present-day clusters. These differences between past and present clusters implies that clusters were probably still evolving significantly in the 2.5 billion years between redshift 2 and 1, but have remained relatively unchanged since then.
Measurements of these distant clusters are quite difficult, and not just because their galaxies are very faint. The large distance also means there is likely to be many “interloper” galaxies in the foreground between us and the targets. The authors attempt to separate the two categories, but doing this with 100% certainty requires spectroscopy, which is quite difficult to obtain.
Follow-up spectroscopic observations will also help determine if the red sequence galaxies have really ceased all star-formation. Galaxies that are forming stars but shrouded in large envelopes of dust could also have very red colors . Hubble’s successor, the James Webb Space Telescope – with infrared sensitivity and a suite of high-resolution spectrometers – will easily distinguish between these types of galaxies, and will improve these studies of high-redshift clusters in the decade to come.
Author