- Title: Contamination of Broad-Band Photometry by Nebular Emission in High Redshift Galaxies: Investigations with Keck’s MOSFIRE Near-Infrared Spectrograph
- Authors: Schenker, M.A.; Ellis, R.S.; Konidaris, N.P; Stark, D.P.
- First Author’s Institution: CalTech
Reionization is the period in the history of the universe when neutral hydrogen was ionized by the emergence of the first luminous sources. This period began about 400 Myr after the Big Bang and lasted until 2 Gyr afterwards. Reionization marks the time when galaxies started to coalesce and form. Understanding the galaxies that were formed just after reionization ended helps us understand how structures formed in the early universe.
Lyman break galaxies have redshifts of ~ 3-7, which corresponds to the end of reionization. The Lyman break, which is analogous to the Balmer break, forms because at wavelengths shorter than 912 Å radiation is completely absorbed by neutral gas. Recall that the Balmer series deals with hydrogen atoms in the first excited state (n=2) and the Lyman series deals with hydrogren atoms in the ground state (n=1). There is a minimum amount of energy required to ionize a hydrogen atom from each of these states. At higher energies (shorter wavelengths) the opacity of the material increases, so the flux decreases. This effect causes a sudden decrease in the flux at both of the energies, referred to as the Balmer break and the Lyman break. If this break falls between two filters, galaxies will appear in images taken through a redder filter and not be present in images taken through a bluer filter. This Lyman break method is one way astronomers find galaxies at high redshift. The use of multiple filters, typically in the optical and near IR, allow for the range of redshifts.
Astronomers will often use broad-band filters to take images of galaxies. Using this color information, they are able to piece together spectral energy distributions that help determine factors such as the mass and star formation rate of each galaxy. This paper addresses a potential issue in this approach for these Lyman break galaxies.
Emission nebulae are clouds of ionized gas. Some of these emission lines, such as Hα, [O III], or [O II], might contaminate the broad-band observed fluxes. In particular, these authors looked at [O III] at 5007 Å when it is shifted into the IR K-band, at redshifts between 3.0 and 3.8, to see how this emission would affect the observed flux. They obtained NIR spectra using the MOSFIRE instrument on the Keck Telescope to measure the strength of this line and determine its contribution. The K-band filter used for the photometry covers approximately 2 μm up to 2.3 μm. Since the authors now had spectra covering this range, they could sum the flux in this range and it should match the flux from the photometry.
However, this flux still contains the contamination from the oxygen line, so that extra flux is then subtracted out. This is shown in the figure below. The red points at 2 μm show the contaminated flux from the photometry. The black points below those show the uncontaminated flux measured in this paper.
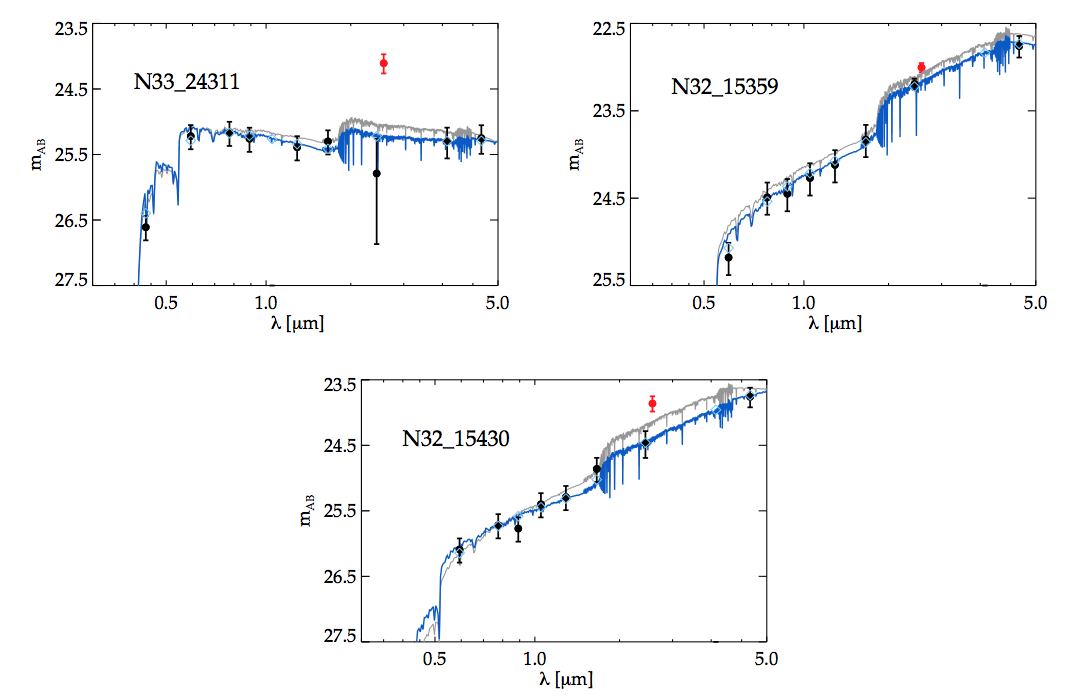
Old and new spectral energy distributions from three galaxies studies here. The red data points include the contaminated light while the black data points at 2 μm show the work done here to eliminate this contamination. The grey and blue spectra show the before and after fits to the data.
Now that we know the uncontaminated broad-band flux, a better spectral energy distribution can be computed. The figure above shows the before and after distributions. The grey spectrum shows the best fit including the contaminating light. The blue spectrum shows the new fit to the data after this extra light has been removed. You can see how the flux around 2 μm decreases, as we expect it to from what we just discussed.
The affect of this depends on what other data exists for each galaxy. For those galaxies with other data above the Lyman break, the new fit changes the mass by only 3%. But for higher redshift galaxies, z ~ 6-7, where the K-band is often the only measurement above the Lyman break, this contamination can cause changes in the measured mass of 36%, where the uncontaminated measurement is lower.
The results show the importance of considering these emission lines from nebulae. The changes in the measured masses are high at high redshift, which affects our understanding of mass and star formation rate for the earliest galaxies. This paper also serves as a good reminder of the importance of carefully considering anything that might cause errors in your data.
Author