- Title: Accurate weak lensing of standard candles. II. Measuring σ8 with Supernovae.
- Authors: Miguel Quartin, Valerio Marra and Luca Amendola.
- First author’s intitution: Instituto de Física, Universidade Federal do Rio de Janeiro, Brazil.
- Status: Accepted for publication in PRD.
Supernovae are so bright that we can detect them up to very far distances. The record holder is this supernova, at a redshift of 1.914, which occurred when the Universe was approximately 3.5 billion years old. The light from such a distant supernova must have travelled an immense distance to arrive at our telescopes. The journey is hard: photons from the supernova encounter obstacles along the way. One such type of obstacle is an overdensity of matter. We know our Universe is clumpy and that structure forms (galaxies, clusters, filaments, sheets) across a large range of scales. When photons encounter a large overdensity of matter, their path is deflected from a straight line in a phenomenon known as gravitational lensing (see this example). This has mostly been a nuisance for scientists looking to determine the expansion rate of the Universe from supernovae, but as more and better observations are within our reach, the gravitational lensing of supernovae can teach us interesting lessons about the Universe too.
What is the trick? The quantity of interest is the distance modulus to a supernovae, which is a way of defining the distance to it. The distance modulus is obtained from the brightness of a supernova, while the redshift of a supernova, which tells us how fast it is receding from us, is obtained from the lines in its spectrum. The relation between distance and redshift depends on the properties of our Universe. This relation allowed scientists to determine that the Universe was expanding at an accelerated rate. The figure below shows the distance moduli to supernovae in the Union2.1 sample as a function of their redshift. There is some scatter of the points about the best fit line. Part of the scatter is due to intrinsic variations of the properties of supernovae, but part could be due to gravitational lensing. If the gravitational lensing contribution could be isolated, one could extract more information about the Universe from this data set and this is the goal of Quartin et al.

The “Hubble diagram” of the Union2.1 supernovae sample, which allows to determine the expansion rate of the Universe.
Gravitational lensing changes the distance we observe because it magnifies a supernova by focusing its light. A brighter supernova seems to be closer to us. How can the lensing contribution to the scatter in the plot above be isolated? First, one needs to assume that the intrinsic contribution to the scatter has the shape of a Gaussian function and that any deviation from a Gaussian will be caused by the systematic effect of gravitational lensing. The authors describe the deviation from a Gaussian in terms of the moments of the distribution. In the figure below, you can see a model of how gravitational lensing (the dotted-dashed blue line) changes the intrinsic distribution of uncertainties in the distance moduli (dashed brown) and magnifies some of the supernovae (solid green).
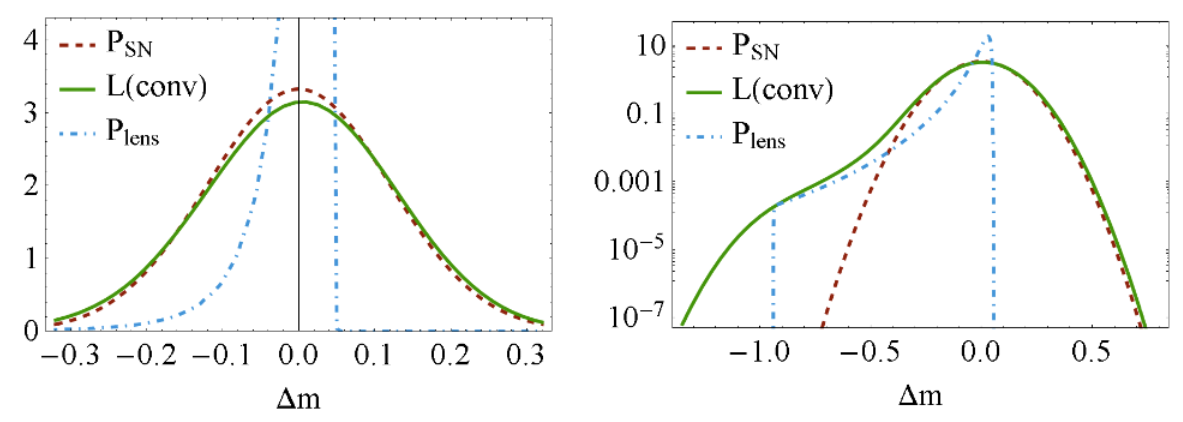
Figure 1 of Quartin et al. Δm is the residual with respect to the best fit in the previous figure. The intrinsic scatter of distance moduli of supernovae (dashed brown), which is subject to lensing (dotted-dashed blue) yielding the final distribution of observed uncertainties (solid green). The right panel is the log-scale version of the left panel for better visualization purposes.
Because gravitational lensing is sensitive to how much matter there is in the Universe and how it is distributed, with these moments, they are able to constrain Ωm0, the relative amount of matter in the Universe today, and σ8, another common parameter that describes the typical density fluctuation inside a sphere with ~100 times the size of a galaxy cluster. The figure below shows forecasts for how well those parameters can be determined from supernovae and their gravitational lensing in the Dark Energy Survey and the Large Scale Synoptic Telescope, one ongoing and one upcoming transient survey, respectively. The red constraints correspond to just using the information contained in the lensing of the supernovae, while the green constrain add the information in the distances to supernovae as well, which is what we are used to seeing. The supernovae sample of the Dark Energy Survey will be too small to be competitive with other probes of these cosmological parameters (such as cosmic shear, galaxy clusters, and the cosmic microwave background). But this method for constraining cosmology is very promising in the case of the Large Synoptic Survey Telescope, which will be able to push the uncertainty in σ8 to the level of several per cent using 500,000 supernovae. The method is also free of many of the systematics that most of those other cosmological probes encounter. So keep an eye on lensed supernovae, they have a promising future.
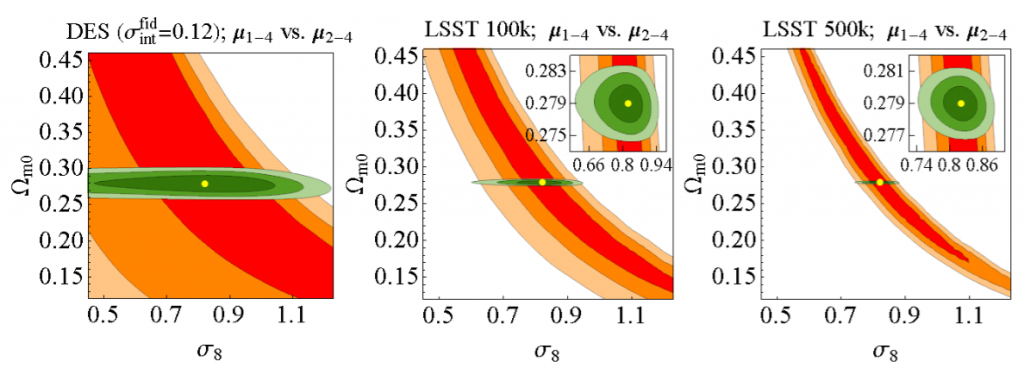
Fig 5 of Quartin et al. The green contours provide a forecast for how well the Dark Energy Survey and the Large Synoptic Survey Telescope will be able to constrain Ωm0 and σ8 using the gravitational lensing of supernovae. The three concentric rings in different shades of green represent 1σ, 2σ and 3σ contours from inside out. (1σ means 68% confidence on the constraints.)
Author