Title: Solar System evolution from compositional mapping of the asteroid belt
Authors: F. E. DeMeo and B. Carry
Institution: Harvard University, MIT
Status: Published in Nature Reviews
In the 1980s, astronomers and planetary scientists thought the Solar System was a well-ordered place. Planets formed in circular orbits and stayed there. The compositions of the planets were dictated by the composition of the disk of gas and dust out of which they formed. The materials in the disk available to form both planets and asteroids varied with radial distance because it was hotter closer to the Sun. This in turn neatly explained the architecture of the inner and outer Solar System. The same picture made sense when scientists looked at asteroids: asteroids of different compositions (types) were grouped together at different distances from the Sun (Figure 1). Asteroids, like planets, were thought to have formed in one part of the Solar System and stayed there.
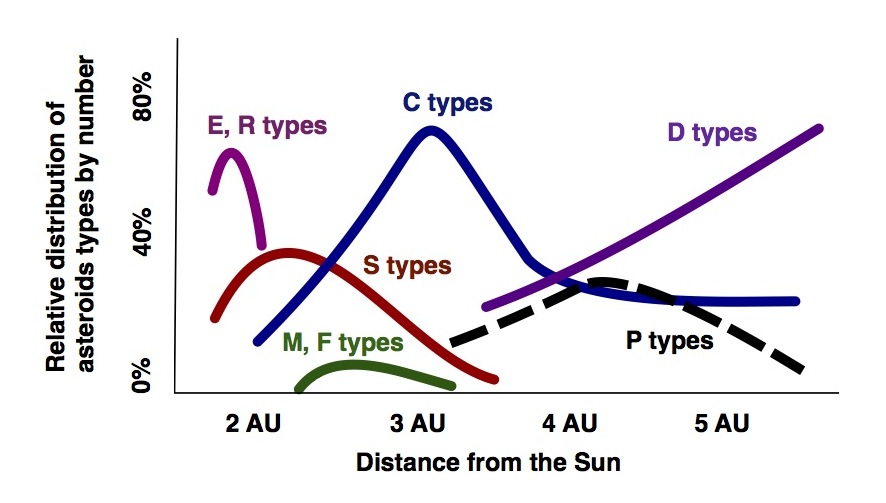
Figure 1. Schematic representation of the results from Gradie & Tedesco (1982). The colored lines represent the rough distribution of asteroids of different compositions, or types. The types are indicated on the figure and the colors were chosen to correspond to those in the second figure.
As new observations have been made, we’ve had to revise the 1980s picture of ordered planet formation. Efforts to explain the structure of our Solar System drove the community to adopt a more chaotic view of planet formation, one in which planets’ orbits can change dramatically and smaller bodies like asteroids can be flung about. One highly influential and successful model for planet migration in the Solar System, the Nice model, has the giant planets undergoing rapid migration and scattering smaller objects throughout the Solar System.
Our knowledge of the composition and distribution of asteroids has developed along with theories of planet migration. A decade ago, a few rogue asteroids were known to be “polluting” the main asteroid belt: while located in the main belt, their compositions indicated that they had formed elsewhere in the Solar System. But now, as compositions have been measured for more and smaller asteroids, it has became apparent that the asteroid belt is comprised of a mix of asteroids of many different compositions. It’s not that the observations from the 1980s were wrong: large asteroids are grouped in distinct regions by their compositions. It’s just that when you are able to look at smaller asteroids, a different picture emerges.
Figure 2 below is the modern version of the previous diagram. There’s one big difference: the y axis, instead of showing the fraction of asteroids that are of a given type, is the total amount of mass of each type. Our knowledge of asteroids today extends to much smaller asteroids than it did in 1980, as our ability to detect them has improved: the dashed horizontal line two-thirds of the way up indicates the sensitivity of studies in the 1980s. The sensitivity of this plot is two orders of magnitude better in mass than it would have been thirty years ago. When DeMeo and Carry break up the asteroids into different size bins and look at the distribution of types of asteroids as a function of distance from the Sun, they see that the strongest trends are in the biggest asteroids.
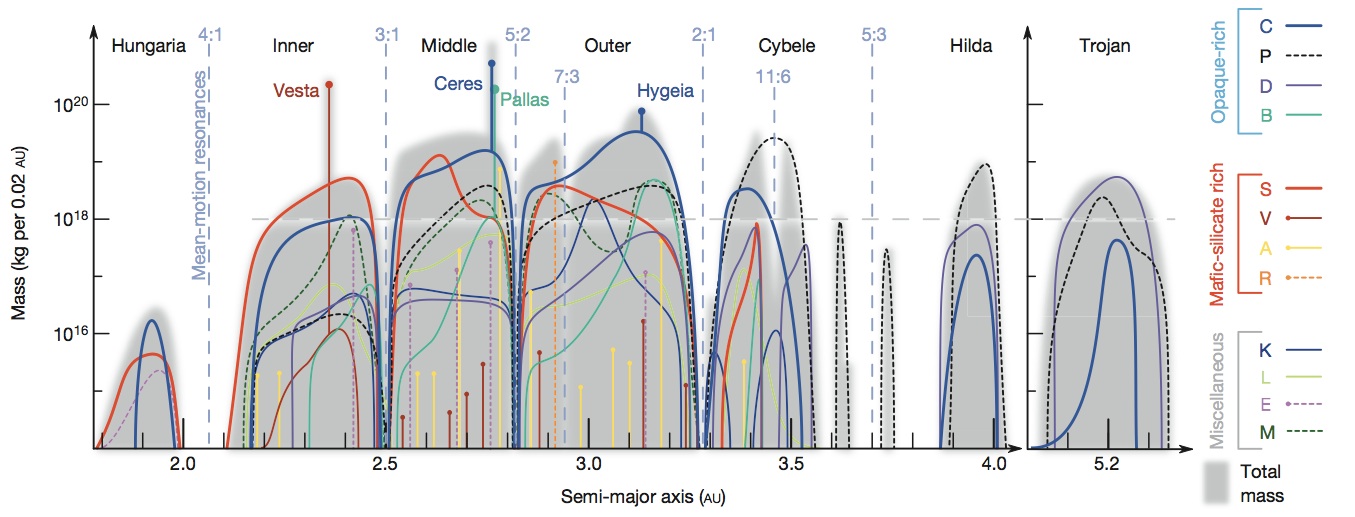
This plot (Figure 3 from the paper) is similar to the first plot I showed. The x axis shows distance from the Sun in AU. The y axis is different though, and it shows the amount of mass per 0.02 AU bin (using logarithms). The shaded grey area is the total amount of mass at each distance. The colored lines show the the amount of mass in each asteroid type. Vertical bars indicate a single, massive asteroid.
This plot illustrates the work done by DeMeo and Carry in their 2013 paper, which is based on photometry of 34,503 unique asteroids from the Sloan Digital Sky Survey (SDSS). They used the photometry to assign asteroids a type, working to develop a classification scheme that is consistent with the established asteroid types (asteroid types relate to their compositions, and the established types are based on more detailed spectral observations).
Because many small asteroids would have been missed, they limit their study to asteroids larger than 5 km. A 5 km asteroid is the smallest that they could detect in the outer reaches of the main asteroid belt, no matter what type it is. This is a very important step, because some asteroid types are brighter than others and would be over-represented in the final sample if this step was not taken. Even so, their sample is not complete: SDSS didn’t observe every asteroid and so they also must correct for this.
When everything was said and done, DeMeo and Carry arrived at the figure above, which shows the distribution of asteroids of different types (compositions) throughout the asteroid belt. While work remains to be done, the discovery of the complex distributions of different types of asteroids has been significant in developing the current picture of planet formation, in which our early Solar System was a much more dynamic and chaotic place than originally was thought.
Author
Trackbacks/Pingbacks