Paper: A Global Cloud Map of the Nearest Known Brown Dwarf
Authors: I.J.M. Crossfield, B. Biller, J.E. Schlieder, N.R. Deacon, M. Bonnefoy, D. Homeier, F. Allard, E. Buenzli, Th. Henning, W. Brandner, B. Goldman, T. Kopytova
First Author’s Institution: Max Planck Institut für Astronomie, Königstuhl 17, 69117, Heidelberg, Germany
Paper status: Published in Nature
Wouldn’t it be cool if we could check the weather on other planets? It isn’t out of the question in our solar system where we can resolve the banded cloud structures on Jupiter and the polar vortices on Saturn. However, exoplanets are much too faint and small, so we won’t be tuning in to the weather report for any of the many Kepler planets just yet. What about brown dwarfs, celestial objects between gas giant planets and stars in size? Today’s astrobite discusses a paper in which the authors have made an atmospheric map of a nearby brown dwarf and inferred the presence of clouds on its surface.
The Targets
Brown dwarfs are gaseous bodies that range in size from as small as twice Jupiter’s mass to as large as about 8% the mass of the Sun. Only discovered about 20 years ago, they are not massive enough for their cores to get sufficiently hot for sustained hydrogen fusion (although they do go through a relatively short deuterium-burning phase, which differentiates them from planets). After exhausting their deuterium supply, these substellar objects slowly contract and cool over time, releasing gravitational potential energy and eventually fading from view. Their surface temperatures, however, can be relatively similar to those of gas giant planets, and so their atmospheres may exhibit similar phenomena to those of planets. For example, their spectra often show rich absorption features from molecules such as CO and H2O. The brown dwarfs targeted in this study (called Luhman 16A and B) are a binary pair, weigh in at about 3-5% the mass of the Sun each, and also the nearest brown dwarf system to us – only 2 pc away! These substellar neighbors were introduced here on astrobites last year, when Ben discussed a paper in which the presence of clouds was predicted simply from the light curve of the system.
The Data
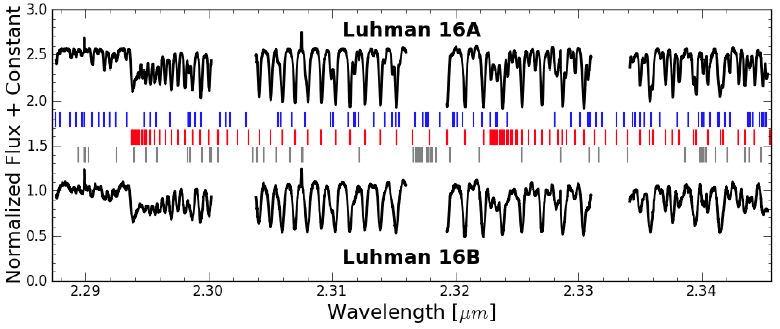
Figure 1: High-resolution near-infrared spectra of the brown dwarfs Luhman 16A and 16B. The blue and red markers indicate the positions of H2O and CO absorption features, respectively. Luhman 16B shows broader lines, indicating it is rotating faster. These high-quality spectra were key to accurately modeling the surface of Luhman 16B (fig. 1 from Crossfield et al.).
Thanks to the Luhman 16AB system’s proximity, Crossfield et al. were able to separate the light from the two objects, resolving the individual brown dwarfs. They took very high-resolution spectra of the objects (Figure 1) using the CRIRES spectrograph on the European Southern Observatory’s Very Large Telescope in Chile. They monitored their targets in the near-infrared (where brown dwarfs are the brightest) during a single observing night for about five hours – the previously estimated rotation period of Luhman 16B. The data were of sufficiently high fidelity that the widths and shapes of the spectral absorption features could be very precisely measured, which was the key to being able to make a surface map using Doppler imaging.
The Technique: Doppler Imaging
Even at 2 pc it is impossible to directly resolve the surfaces of these tiny not-quite-stars. However, spectra encode extremely detailed information. Ideal spectral lines are caused by absorption at specific wavelengths corresponding to transitions between quantum mechanical energy levels of the atom or molecule. However, observed spectral lines are not infinitely narrow, but are broadened by a number of mechanisms. The key mechanism for this study is so-called Doppler broadening, which is caused by the Doppler effect. If a rotating star (or brown dwarf) has its rotational axis perpendicular to your line of sight, then one side of the star will be effectively moving towards you, blueshifting the light from that side. Similarly the other side will be receding and the light redshifted. These effects change the wavelength of the absorption slightly to the blue and red, and the net total over the whole rotating surface is a broadened line. Now think of dividing the full surface of the object into sectors; each sector will emit some fraction of the object’s total flux, and it will be over a narrow range of wavelengths corresponding to that sector’s current location and corresponding Doppler shift. The total observed spectrum will just be the sum of all the sectors’ spectra. Now what if there was one sector that was much darker than the rest, and thus its spectrum would be much lower in flux than the other sectors’? When it was on the back side of the object, the total spectrum would always look the same. But as the dark sector came into view, first on the side moving towards you, then at the center, and finally moving away, the total spectrum would show a small deficit of flux first on the blue side of the line, then the center, and finally on the red side. This technique, which is called Doppler Imaging, had been used previously to map spots on the surfaces of stars; on a brown dwarf, it maps the cloud structure.
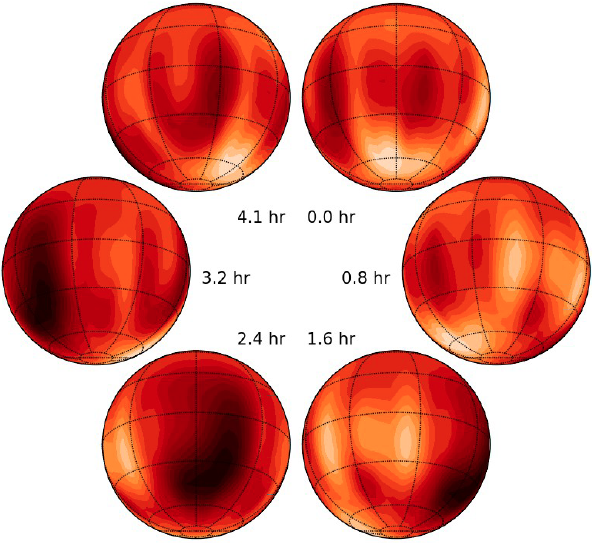
Figure 2: Surface map of the brown dwarf Luham 16B in time series, starting at upper right and proceeding clockwise. The bright region near the south pole and dark mid-latitude area are suggestive of stratified cloud layers in the atmosphere (fig. 2 from Crossfield et al.).
The authors were able to model the surface of Luhman 16B using the Doppler Imaging technique described above (Figure 2). They divided the surface of their model brown dwarf into 200 sectors then compared the expected total model spectra from thousands of configurations of bright and dark regions on the surface to the observed spectra. To test their method, they generated simulations with various spot configurations and checked how well they could recover them with Doppler Imaging. They find that large-scale features are well-recovered, but symmetrical features such as bands (as seen on Jupiter) are more difficult to reliably detect. They conclude that the bright region close to the pole and the dark mid-latitude area (see the figure at right) are very likely real features in Luhman 16B’s atmosphere!
The Forecast is Sunny
The presence of light and dark zones on the brown dwarf’s surface is interpreted as being due to patchy clouds (though in this case made of carbon monoxide in addition to water vapor). The dark zones are thick clouds that block the light from the hotter, deeper atmospheric layers, while the bright zones are holes in the cloud layer. This interpretation is consistent with previous theoretical work that predicts that brown dwarfs should have stratified cloud layers. The Doppler Imaging technique thus offers great promise to map not only stars, but brown dwarf atmospheres. With a bigger telescope, this could potentially even be applied to directly detected exoplanets in the future. Stay tuned, the extrasolar weather reports may start coming in within the next decade!
Author
What are these clouds made of? Are these cloud structures just differences in the opacity of the gas? I hope this method will be applied to exoplanets someday, what a great tool to probe the character of atmospheres.