Title: Butterfly diagram of a Sun-like star observed using asteroseismology
Authors: M. Bazot, M.B. Nielsen, D. Mary, J. Christensen-Dalsgaard, O. Benomar, P. Petit, L. Gizon, K.R. Sreenivasan, T.R. White
First Author’s Institution: Division of Sciences, New York University Abu Dhabi, United Arab Emirates; Center for Space Science, NYUAD Institute, Abu Dhabi, UAE
Status: Accepted in A&A Letters [open access]
Magnetic mysteries
The Sun may be the closest star to us here on Earth, but there’s plenty about the Sun that we still don’t understand. One of the ongoing mysteries of the Sun, and really of stars in general, is their magnetic fields.
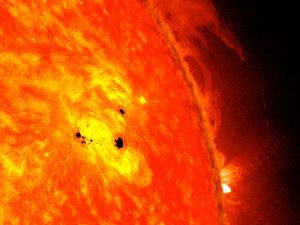
Figure 1: An image showing an active region of the Sun. The dark spots are “sunspots”. Image Credit: NASA/SDO/AIA/HMI/Goddard Space Flight Center.
Astronomers believe that the magnetic field of a star, which is invisible to the human eye, drives some of the stellar activity that we can observe. Starspots, like those seen on the Sun in Figure 1, are examples of such stellar activity. These dark spots appear in places where the star’s magnetic field is highly concentrated.
One way that astronomers have catalogued stellar activity for the Sun, so as to better learn about and model the Sun’s underlying magnetic field, is with butterfly diagrams. Butterfly diagrams, the like one for the Sun shown here, illustrate how the latitude of a star’s active regions change with time.
Unfortunately, it’s a lot harder to resolve stars that are much farther away from us than our conveniently-close neighbor the Sun. For those stars, butterfly diagrams haven’t been so easy to make in practice. One approach has been to make these diagrams for other stars using photometric data. Photometric data can be used to build light curves, which plot the light observed from a star over time. However, modeling these light curves has been hindered by pesky degeneracies in the past, which has made it difficult to tease out butterfly diagrams. Other approaches, such as through long-term Doppler mapping (a technique that’s exquisitely described in this astrobite), have tended to be too sparsely sampled over time; they have only been able to track very large stellar spots, which astronomers only expect to see in stars that are much more active than the Sun.
Today’s authors present an entirely new approach that circumvents these issues. Their approach uses both photometric and asteroseismic data to assemble butterfly diagrams. They demonstrate their approach for the Sun-like star known as HD 173701. But before we can dive into their approach, we need to dive into the surface of a Sun-like star itself.
Beneath the surface of the Sun (and Sun-like stars)
As shown in Figure 2, Sun-like stars have two different heating zones around their core: an inner radiative zone and an outer convective zone. The inner radiative zone gives off heat similarly to how a fire or person does: through radiation, which is the emission of photons. The outer convective zone, on the other hand, transfers heat similarly to the way that boiling water does: a blob of material moves through a surrounding fluid, carrying heat with it. In a pot of boiling water, hotter blobs of water rise from the bottom towards the surface, while cooler, denser blobs at the surface sink towards the bottom.
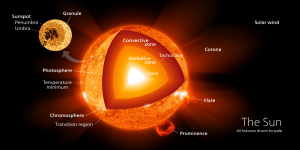
Figure 2: A diagram showing a cross-section of the Sun. Image Credit: Made by user Kelvinsong on Wikimedia Commons.
For Sun-like stars, these two heating zones rotate differently with time. While the inner radiative zone is known to rotate as if it’s one solid body (like a ball rolling down a street), the outer convective zone actually rotates differently at different latitudes. The Sun’s equator, for example, rotates about 50% faster than the Sun’s poles. Stellar activity that astronomers are interested in, like starspots (dark regions near the star’s surface) and plages (bright regions near the star’s surface), are involved with the outer convective zone of the star.
Putting it all together
To extract a butterfly diagram for the star HD 173701, today’s authors first used asteroseismic data. Asteroseismology is the study of stellar oscillations known as “starquakes”, which can be detected as little periodic variations in a star’s brightness over time. Just as earthquakes help scientists study the inner structure of Earth, these starquakes help astronomers study the inner structure of stars. The authors used recently published asteroseismic data from Kepler to figure out HD 173701’s latitudinal differential rotation, or how the rotation rate of the star varies at different latitudes.
The authors then used Kepler photometric data to build a set of light curves for HD 173701. A light curve for a star can indicate stellar activity: as the star rotates, plages and spots rotate in and out of view of the telescope. When they are in view, these active regions increase/decrease the total light observed from the star over time, which in turn affects the light curve. (Notably these active regions don’t appear perfectly periodically in the light curve, and active regions themselves change over time.) The photometric data tracked the light from HD 173701 over an approximately four-year time period. By modeling light curves of the data, the authors determined how the rotation rates of the star’s active regions changed over time.
On its own, the photometric data didn’t provide enough information to tell where exactly the active regions were occurring on the star’s surface. But by taking the rotation rates from the photometric data, and combining it with information about the star’s latitudinal differential rotation from the asteroseismic data, today’s authors were able to determine the latitude of the active regions. And from that, they produced a butterfly diagram for HD 173701, as shown in Figure 3.
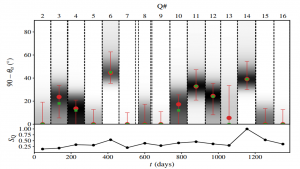
Figure 3: A butterfly diagram for the Sun-like star HD 173701, constructed using both asteroseismic and photometric data. For the top panel, the top x-axis gives the quarter in which the Kepler observations occurred (‘2’ refers to Quarter #2, for example), while the bottom x-axis gives the median time duration. The y-axis gives the latitude in degrees, where 0 corresponds to the star’s equator and 90 corresponds to one of the star’s poles. The red dots in the top panel represent the estimated latitudes for the active region for each quarter. The red error bars show credible intervals around the estimated value within 68.3%. The green squares are values the authors estimated using simulated data, which agree well with the red dots estimated from actual data. The shaded regions essentially indicate the likelihood of the latitude being that value, where black is very likely and white is not likely at all. The bottom panel shows how the amplitude of the signal from which the authors derived their estimates, normalized to 1, varied with time. Figure 3 in the paper.
The authors reported that their butterfly diagram is the first of its kind to be derived using asteroseismic and photometric data. Their approach really highlights the potential power of asteroseismology for learning more about stellar magnetic fields, as well as other mysteries shrouding the Sun and Sun-like stars. In the future, they envisioned that this approach to butterfly diagrams will provide a great way to systematically process star surveys – like those from the future space mission PLATO – and allow our knowledge of stellar magnetic fields to really take flight.
Author