Title: Stellar rotation-planetary orbit period commensurability in the HAT-P-11 system
Authors: Bence Béky, Matthew J. Holman, David M. Kipping, Robert, W. Noyes
First Author’s institution: Harvard-Smithsonian Centre for Astrophysics
Status: Accepted to ApJ
The orbits of some recently discovered exoplanets seem to be synchronised with the rotation of their host stars. Can this mystery be explained?
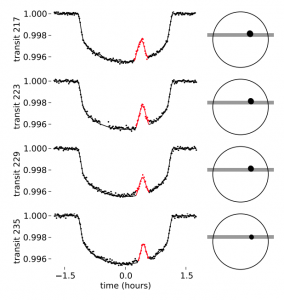
Figure 1. Every sixth transit light curve shows the same transit anomaly. The same star spot is being transited each time, providing evidence for a 6:1 ratio between the planet’s orbit and the star’s rotation.
In 2008 the planetary system, Boo was noticed to be unusually behaved: the star seemed to spin exactly once for every orbit of the planet. At the time it was unclear whether this synchronicity was due to star-planet interactions, or just plain coincidence. Since then however, a handful more systems with planets that orbit at integer multiples of their host star’s rotation periods have been discovered. In this paper, HAT-P-11 is confirmed as a synchronous system in which the star rotates once for every six orbits of the planet. As more and more systems like this are discovered we have to ask whether some physical mechanism is responsible; is it physics or fluke?
HAT-P-11
The orbital period of exoplanet, HAT-P-11 b seems to be almost exactly six times the rotation period of its host star. This was first observed in 2010 and further evidence for this perfect 6:1 ratio between planetary orbit and stellar spin is provided, in this paper, by the transit light curves themselves.
Transit anomalies
When exoplanets transit their host stars they produce a characteristic ‘U’ shaped light curve. If a star-spot lies along the transit chord, an upwards ‘blip’ (a transit anomaly) will appear in the light curve. Four transits, separated by six orbital periods are shown in figure 1. Each of these light curves shows the same transit anomaly occurring at the same time. It looks like the same spot is being transited four times in a row. That means the star spot must be in exactly the same position every six orbital periods, i.e. the star spins once for every six orbits of the planet.
The orbital period of a transiting planet is easy to measure – it’s just the time elapsed between transits. Stellar rotation periods, on the other hand, provide a little more of a challenge.
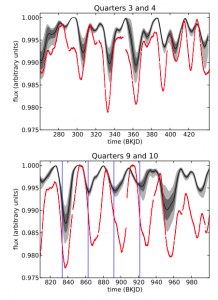
- Figure 2. The Kepler light curve of HAT-P-11 in red and the light curve model in black with confidence regions in grey. The model is calculated, independently of the real light curve, from information about the star spot in the transit light curves of figure 1. The parameters of the model have not been optimised to fit the data, the idea here is just to show a qualitative comparison between the two. The blue lines in the bottom panel show the times of the four transits in figure 1.
Measuring the stellar rotation period
A dark spot on the surface of a star will reduce its overall brightness. As the star rotates and the spot moves behind the stellar limb, out of view, the star’s brightness will increase. Spots on the surface of rotating stars produce periodic dips in brightness, so to measure stellar rotation periods you simply measure the timescale of variability in light curves. Béky et al use two different but complementary methods to detect periodic signals in the light curves of HAT-P-11: a periodogram and an auto-correlation function. They measure a stellar rotation period of ~30 days.
Light curve modelling
Remarkably, from the four light curves in figure 1, the authors can infer enough about the occulted spot to model the out-of-transit light curve. By estimating the size of the spot from the transit anomaly, and assuming that it is the dominant spot on the stellar surface, they predict what the out-of-transit variability should look like. Figure 2 provides a qualitative comparison between the observations (in red) and the prediction (in black). Spot-induced stellar variability is notoriously difficult to reproduce with theoretical models, so the agreement in figure 2 is pretty good!
Confirming the 6:1 ratio
Measuring stellar rotation periods from light curves is an imprecise process; differential rotation (different latitudes rotating at different speeds) can produce deviations from strict periodicity. In order to independently validate the 6:1 ratio the authors use a neat trick. They look for matching transit anomalies in every sixth transit. They also look for matches in every fifth and fourth – a whole range of integer values. If transit anomalies occur in transits that lie six transits apart far more often than four or five, that provides evidence for the 6:1 ratio. Figure 3 shows the occurrence rate of repeating anomalies versus the number of separating transits. There is an increased rate at 6, 12 and 18 transit separations, verifying the 6:1 ratio hypothesis.
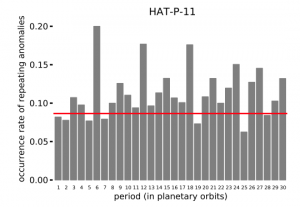
Figure 3. An increased occurrence rate of repeating anomalies lying at multiples of 6 provides further evidence for the 6:1 ratio.
An explanation
Is this observed integer ratio between orbital and rotation periods the result of star-planet interaction, or a simple coincidence?
The authors offer an explanation for this phenomenon. They suggest that a planet’s magnetic field could interact with its star’s to increase the number of star spots at certain latitudes of the stellar surface. If one latitude of the star is particularly spotty and the star has differential rotation, then the rotation period measured from the light curve will not be the same as the equatorial rotation period of the star. Now imagine that the planet’s orbital period lies somewhere between the rotational period of the star’s pole and that of its equator. The planet will be synchronised with one particular latitude of the star and, if it excites star spot formation at that latitude, it will look like the two objects spin in unison.
Is the observed synchronicity of HAT-P-11 caused by planet-induced spot formation at preferred stellar latitudes? This question will only be answered when we find more of these mysterious systems. We had better keep an eye out for them!

Trackbacks/Pingbacks