- Title: The Discovery of a Secondary Eclipse of HAT-P-11
- Authors: K. F. Huber, S. Czesla, and J. H. M. M. Schmitt
- First Author’s institution: Universität Hamburg
- Status: Accepted by Astronomy & Astrophysics
HAT-P-11 is an interesting planetary system, and has been discussed on Astrobites before. The system has a transiting Neptune-sized planet (HAT-P-11b; hereafter The Planet) with water vapor in its atmosphere (Figure 1). The host star HAT-P-11 (hereafter The Host Star) is also known to be highly active—and has starspots that have been periodically detected.
The exciting news in today’s paper is the first detection of The Planet’s secondary eclipse, giving us insight into the thermal structure of its atmosphere. Is it warm? Cold? Let’s find out.

Figure 1: Artist concept of The Planet, Neptune-sized with a clear atmosphere, shown crossing in front of its host star. Credits: NASA/JPL-Caltech.
A closer look at secondary eclipses
Transiting exoplanets have been discussed extensively here on Astrobites. In a planet transit, the planet crosses in front of its host, blocking some of the light from the star (see Figure 2). In a secondary eclipse, the planet crosses behind the star, and the light from the planet is blocked. A transit is more easily detectable than a secondary eclipse, as the planet is much fainter than its host star (a planet’s luminosity stems from its own thermal radiation and the reflected light from its host). With a clear detection, both signals give valuable information about the planet: from a transit we can measure the size (radius) of the planet with respect to the host; from a secondary eclipse we gain insight into the thermal structure of the planet’s atmosphere.
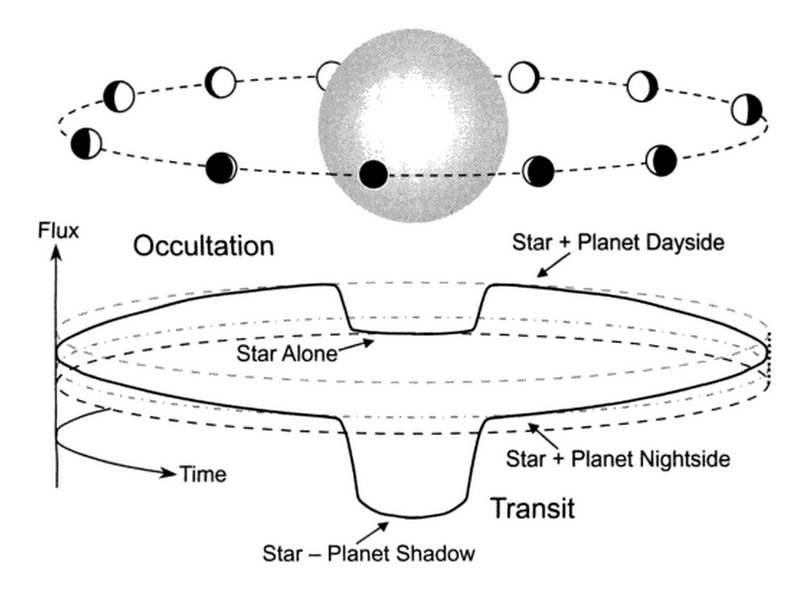
Figure 2: A comparison between transits and secondary eclipses (also sometimes called occultations). In a planetary transit, the planet crosses in front of the star (see lower dip) blocking a fraction of the star’s brightness. In a secondary eclipse, the planet crosses behind the star, blocking the planet’s brightness (see dip in the middle). The latter dip in brightness is fainter due to the faintness of the planet. Image credit: Josh Winn.
Mining the Kepler data: looking for a secondary eclipse
The authors used the Kepler dataset to hunt for a secondary eclipse of the planet. By simultaneously fitting the observed transits along with a model of the secondary eclipse, the authors were able to detect its tiny signature. Figure 3 compares the transit of The Planet (deep) and its secondary eclipse (tiny).
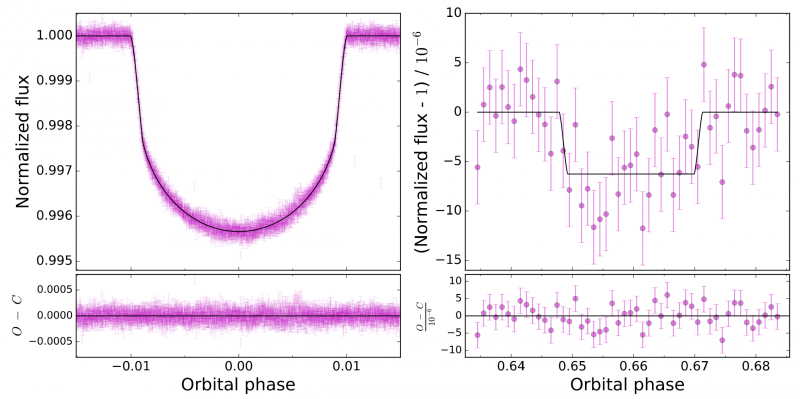
Figure 3: Data (pink) demonstrating the Primary transit (left upper panel), and secondary eclipse of The Planet (right upper panel), along with the best-fit models in black. The lower panels show the residuals of the data minus the model.
Large swings in temperature
Using the precise timing of the secondary eclipse, the authors precisely pinned down the orbital eccentricity of the planet to 0.26459. The orbit of the planet is therefore significantly elliptical, meaning that the star-to-planet distance varies considerably as the planet orbits arounds its host. The atmospheric temperature of the planet therefore varies greatly along its orbit. Figure 4 shows the change in atmospheric temperature of The Planet as a function of orbital phase for two different likely models. Forecast: boiling skies.
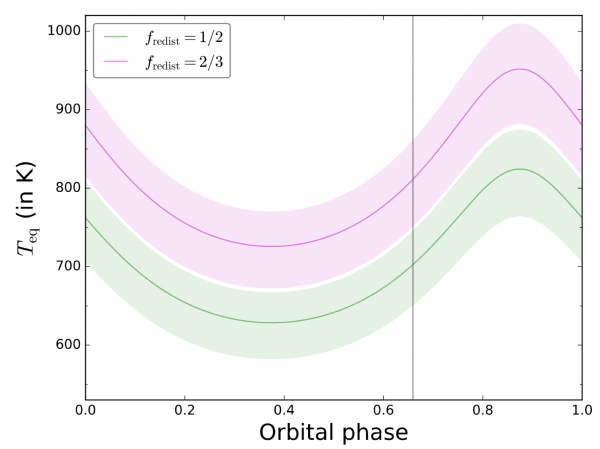
Figure 4: Atmospheric temperature of The Planet as a function of orbital phase, showing significant variations along its orbit. This planet is warm.
A future look
Like mentioned above, secondary eclipses are hard to detect, and the detection of this signal relied on the high quality and long-baseline of the Kepler dataset. Future observations at near infrared wavelengths (e.g., with JWST) might be able to resolve the planetary phase curve further, and give added insight into the physics that governs the structure of this exciting planet.
Author
I want to know what are the apps or software that allows to produce the graph in figures 3 and 4…PS: I use linux and I want to know
Those plots were generated with Matplotlib (http://matplotlib.org), a package to be used in a Python programming environment.
Is it not ROOT or SAGE or GNUplot? What about user graphical interface? Or is it done from terminal?
I am not aware of any graphical user interfaces to use Matplotlib. In order to use it, you need to write a piece of code in Python (which is an interpreted language, therefore easier to write than, say, C or Fortran code). There are examples in the link I sent in my previous reply. If you want to learn Python (and I highly recommend it, whatever career path you are in or choose), there are many learning guides in the internet; just pick one and enjoy!