Title: Inferring the rate and distribution of Earth-like exoplanets from noisy individual-planet inferences.
Authors: Daniel Foreman-Mackey, David W. Hogg, Timothy D. Morton
First Author’s institution: New York University
Status: Submitted to ApJ
The Planet Distribution
We want to know how common Earth-like planets are. We also want to know how common Jupiter-like planets are, Neptune-like planets, hot-Jupiters, super-Earths, etc, etc. We can calculate the occurrence rate of all these different types of planets, i.e. the ‘planet population distribution’, from a homogeneous data set like Kepler’s, but it’s not as simple as you might first think. You can’t just count up all the exoplanets that fall within certain ranges of radius and orbital period — you have to take detection efficiency into account. Big exoplanets are much easier to find than small exoplanets, so if you took this naïve binning approach you would (wrongly) conclude that bigger exoplanets are more common.
The authors of this paper re-calculate the planet population distribution found by Petigura et al. in November, 2013. They use a more flexible model, take observational uncertainties into account and get a very different result.
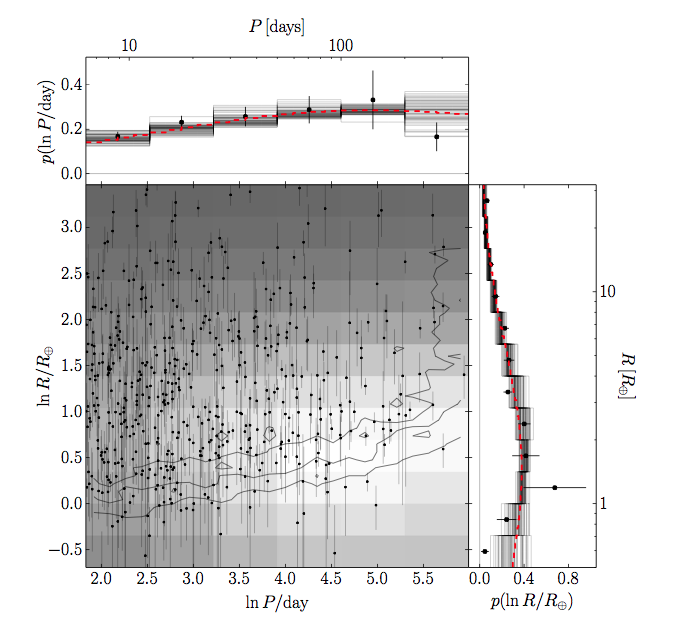
Figure 1. The distributions in planetary radii and orbital period for a fake set of exoplanets. The grey scale in the central panel shows the underlying distribution from which the data points are drawn. The two histograms above and to the right of the central panel show the number of planets falling in each bin. The red dashed lines in the histogram panels show the true underlying distribution used to generate the fake data. The black lines show the results – draws from the posteriors of the model parameters – and the points show what you get if you weight the bin heights with the inverse-detection efficiency. The modelled distribution result is less precise but more accurate than the inverse-detection efficiency result.
Previously…
Petigura et al. measured their detection efficiency for Kepler planets by injecting fake planet transit signals into the Kepler light curves of 42,000 Sun-like stars and recovering them using their own detection algorithm. They binned the detected exoplanets according to radius and orbital period and calculated an exoplanet population distribution by weighting the number of planets in each bin by the inverse of their detection efficiency. The authors of this paper argue that this inverse-detection efficiency weighting technique is not the right thing to do.
Testing the model
Foreman-Mackey et al. use a histogram, where the parameters are the bin heights, to model the population of exoplanets. They assert that the distribution should be smooth; there shouldn’t be vastly more Neptune-radius planets than nearly-Neptune radius planets for example (that’s not to say that that isn’t possible in nature, but we have no a priori reason to think so. You can see why population studies are so closely tied to formation mechanisms — if we were to find such a spike in Neptunes it would mean they are much better at forming than nearly-Neptunes). They use a Gaussian process (GP) as a regulariser, forcing the distribution to be smooth. See this astrobite from Ben Montet for more about GPs.
Foreman-Mackey et al. test the effectiveness of their model on a fake data set. They make up some exoplanet distribution and draw random samples from it — this is their fake data. They then use their model to try to recover the underlying population. As shown in figure 1, modelling the bin heights using a GP regularisation instead of simply weighting the individual bins with the inverse detection efficiency produces a less precise but more accurate estimate of the underlying distribution.
Having checked their method works the authors apply it to real data from Petigura et al. (2013) — see figure 2.
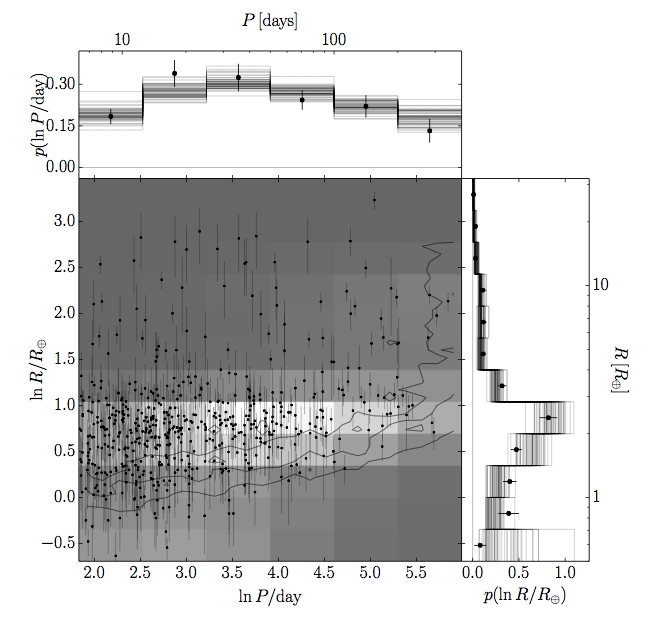
Figure 2. The same as figure 1, except with real exoplanet data. There is no red line in this case because the true distribution is unknown.
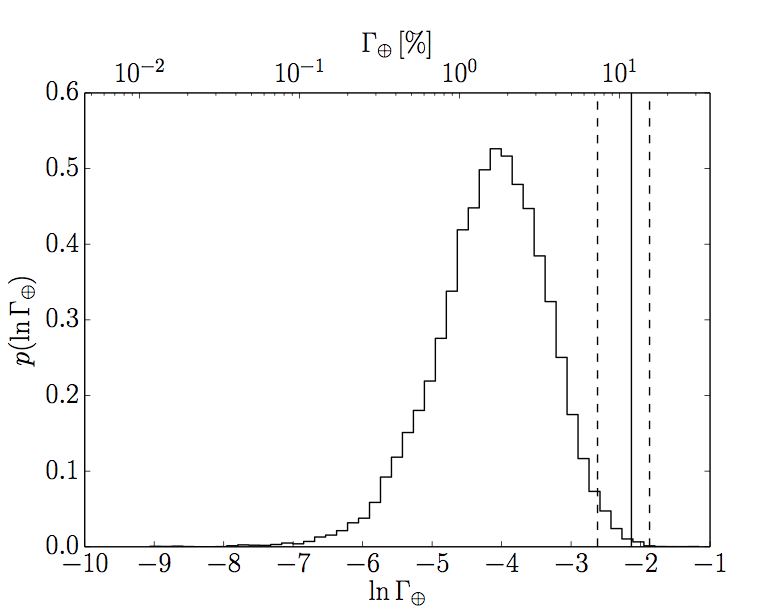
Figure 3. The rate density of Earth-like planets per natural-logarithmic unit. The Histogram shows the posterior probability distribution and the solid line shows the result of Petigura et al., with dashed lines marking the 1 [latex]\sigma[/latex] uncertainties.
How common are Earth-like planets?
Despite Kepler’s best efforts this question is hard to answer because we haven’t found any yet — we have to extrapolate. We have found Earth-sized exoplanets in the habitable zone, like this one, but these planets orbit stars that are much smaller than, and very different to, the Sun. The authors of this paper calculate the rate densities of planets for a range of periods and radii. To calculate the rate of Earth-like planets they integrate over the Earth-radius, Earth-period bin, using the same definition of ‘Earth-like’ as Petigura et al.: an Earth-sized planet with orbital period between 200 and 400 days. Whereas Petigura et al. found that 5.7+0.22-0.017 % of Sun-like stars have Earth-like planets, Foreman-Mackey et al. find that only 1.6+0.011-0.007 % do. Figure 3 shows the posterior probability distribution for the rate density of Earth-like planets, compared with the point-estimate reported in Petigura et al. So what is the cause of this huge discrepancy? Petigura et al. assumed that the period distribution was flat across the Earth-like bin, whereas Foreman-Mackey et al. allowed it to be flexible and find evidence that it is decreasing — see how the period distribution in figure 4 is decreasing for larger and larger periods.
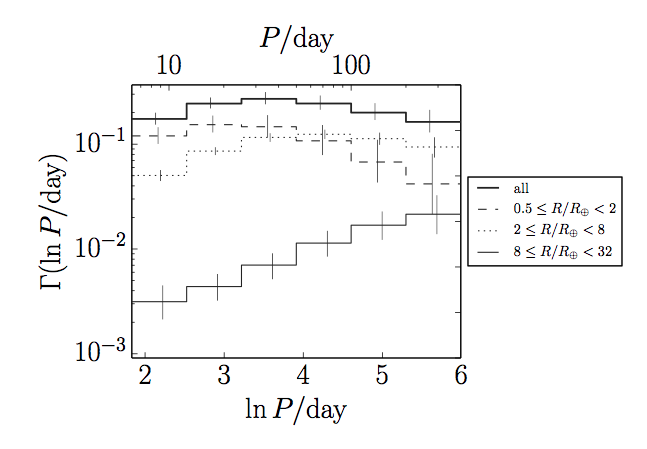
Figure 4. The occurrence rate density as a function of logarithmic period, for different exoplanet radii. The solid line at the top shows the orbital period occurrence rate density distribution for all radii. Note that it turns over at around 50 days and then decreases for larger and larger periods.
Nine Earth-like planets
In the four years of the Kepler spacecraft’s fully operational lifetime it monitored the brightness of about 150,000 stars continuously, searching for exoplanets. The missing jewel in Kepler’s crown is an Earth-like planet orbiting a Sun-like star. But just because no-one has found one yet doesn’t mean we should give up hope. The authors of this paper use their inferred exoplanet occurrence rate density to calculate the number of Earth-like planets detectable in the entire Kepler data set, taking geometric transit probability into account. They find 9.2+5.9-4.0. That might sound like a small number considering there are 150,000 stars in the Kepler field of view… but we KNOW that Earth hunting is hard. If it wasn’t, we’d have found one by now. Look on the bright side: there could be NINE Earth-like exoplanets orbiting Sun-like stars, just waiting to be found in the Kepler data. Better get searching!
Author