- Title: Evidence of cross correlation between the CMB and the gamma-ray sky
- Authors: Nicolao Fornengo, Laurence Perotto, Marco Regis, Stefano Camera.
- First author’s institution: Universita di Torino & INFN, Torino, Italy.
Astronomers have now mapped the sky in many different colors. For example, the Planck satellite has mapped the sky in the microwave frequency, showing us the light from 380,000 years after the Big Bang. The Sloan Digital Sky Survey (SDSS) has mapped a good chunk of the sky in optical wavelengths, identifying millions of galaxies and quasars out to when the Universe was a third of its current age. In the high energy range, Fermi has produced maps of the gamma-ray sky, identifying Galactic and extragalactic energetic sources. All of these maps are not necessarily independent. Whenever the maps share some information, they can be “cross-correlated”.

A map of the sky in gamma-rays as observed by Fermi. The horizontal red band towards the center is emission from our own Galaxy. Individual sources, both from our Galaxy and beyond, are circled in the map, while there is a diffuse background in blue coming from unresolved sources. Some familiar sources of gamma-rays are identified in the map, such as the Crab Nebula, a well-known supernova remnant. This image is credit of NASA/DOE/Fermi/LAT Consortium.
An example of a cross-correlation would be the identification of common sources between two maps: gamma-ray sources from Fermi could also show up as active galaxies observed in SDSS. The reason why this is a useful exercise is that we learn something new by combining the two maps. In this case, we might learn whether all of the active galaxies emit gamma-rays, and with what energies, which will allow us to understand the black holes in the centers of those galaxies a bit better. We could also learn whether the gamma-ray energy emitted is related to the stellar mass or age of the galaxy.
Of course, there are more subtle cross-correlations to be explored. The authors of the paper present results of the cross-correlation between the light left over from the Big Bang and the diffuse gamma-ray sky (the emission that remains after removing point sources). It might look as though these two renderings of the sky had nothing to do with one another at first sight. But there are similarities. The photons from the Cosmic Microwave Background (CMB), observed by Planck, are deflected by matter along their path towards us, a phenomenon called “gravitational lensing“. At the same time, some sources of gamma-rays tend to live in clustered environments, where matter has been accumulating for a while due to gravity. There is more matter in those regions, which means that they act as lenses to the CMB. As a result, one would expect that the cross-correlation between the two maps is not zero and it would tell us how much of the gamma-rays observed by Fermi are extragalactic sources that can also lens the CMB.
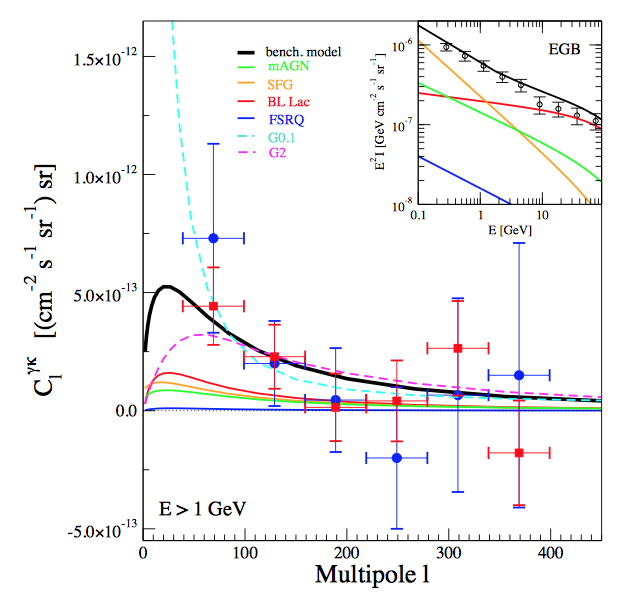
The cross-correlation between the lensing of the CMB from Planck and the diffuse gamma-rays observed by Fermi as a function of inverse angular scale in the sky. The points represent the measurements (blue and red are different two ways of combining the same data), and the solid lines represent the components of the model based on the emission of gamma-rays by star-forming galaxies and AGN. The solid black line is the sum of those components. The dashed lines represent generic models where the gamma-rays sources are at high (z=2, violet) and low (z=0.1, light blue) redshifts. The authors comment that it is more likely that the cross-correlation is due to intermediate redshift sources. The inset shows that the model that corresponds to the solid black line also reproduces the number of gamma-ray photons collected by Fermi at different energies. The amplitude of the solid black curve is not obtained from the model, but fit from the data. This is Fig. 1 of Fornengo et al.
The figure to the right shows the measured cross-correlation between lensing of the CMB and the gamma-ray maps obtained with Fermi, with a peak on large scales (low angular multipoles, l). The points are the measurements (blue and red are just different ways of combining the data); the solid lines represent the contribution from different extragalactic sources to the cross-correlation. In star-forming galaxies, gamma-rays are produced when protons accelerated in supernova shocks collide with each other. In active galactic nuclei (AGN), gamma-rays are produced when particles accelerated in the jets scatter off with photons (inverse Compton) or when they decelerate (bremsstrahlung). The total contribution of all these sources is represented by the black line. The overall amplitude of the model is fit to the data. The authors find good agreement between the model and the observations. There is a peak at low multipoles (large scales), which means that the gamma-rays sources follow the dark matter on those scales. The inset also presents the number of photons detected by Fermi as a function of their energy, again in agreement with the model.
The authors suggest that their findings are in agreement with the idea that the diffuse gamma-ray emission observed by Fermi is due to extragalactic sources such as star-forming galaxies and AGN, at intermediate redshifts (as opposed to low redshifts, shown in the purple line, and high redshifts, represented by the light blue line). In the future, better measurements of this cross-correlation will help us to understand which galaxies produce energetic photons in the Universe, at what epoch, and how they relate to the dark matter halos they inhabit.
Author