- Title: Planet formation signposts: observability of circumplanetary disks via gas kinematics
- Authors: S. Perez, A. Dunhill, S. Casassus, J. Szulágyi, C. Flores, S. Marino, M. Montesinos
- First Author’s Institution: Departamento de Astronomía, Universidad de Chile, Casilla 36-D, Santiago, Chile
- Paper Status: Submitted to Astrophysical Journal
Circumplanetary disks – signposts of planet formation
Disks seem to be ubiquitous in astrophysical literature. Everywhere you look, disks, disks, disks. From galactic disks, protostellar disks, protoplanetary disks, debris disks, etc. And now, circumplanetary disks (CPD)! These are thought to form as a side effect of planet formation, when massive planets of ~ Jupiter size are still embedded in a massive protoplanetary disk. When these forming planets accumulate enough mass (~ 1 Jupiter mass), they evacuate the space around them and open up a gap, free of gaseous material. The protoplanetary disk is then separated into two distinct parts, which are by then only connected by the planetary wake (the gas stream around the planet, connecting the inner and outer disk, centered on the planet, see Figure 1), which still enables the planet to draw some material from the outer part. This material then falls down to the young planet and forms a CPD around it. So far, so good. Unfortunately, as the author’s of today’s paper nicely state, the CPDs have “eluded unambiguous detection so far”. This is mainly because of the fact that the emission of CPDs is very weak in comparison with the emission from the surrounding protoplanetary disk. However, this might have changed in the meantime…
How we think they work
With the rise of ALMA, a new and very powerful interferometer in the Chilean desert, things change. In their work, Perez et al. try to assess whether it is now finally possible to probe and image these very early stages of planet formation and get a glimpse of a CPD in action. To do so, they run fluid dynamics computer models of the stage of planet formation at which CPDs are expected to form (see Figure 1).
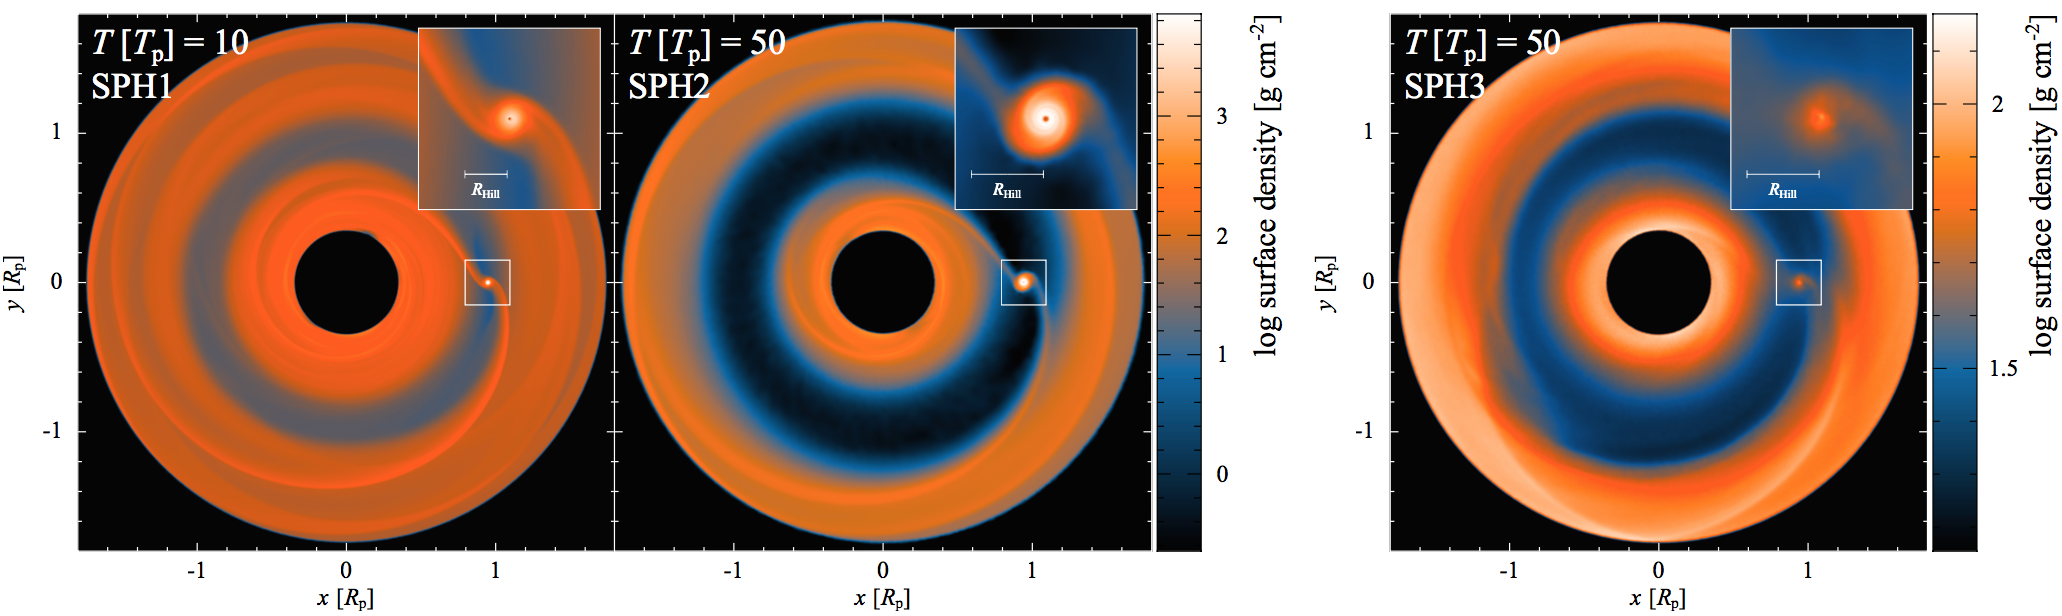
Figure 1: Projected density in the disk at the end of of each simulation of its evolution. The planets in all simulations have formed a CPD, shown by a zoom-in in the upper right corners, which are much more pronounced in the two left runs (isothermal) in comparison with the adiabatic one on the right. The local time of the simulations is given in units of the orbital time of the planet, which means that SPH1 was stopped after 10 orbits and SPH2/3 after 50 orbits of the planet. Source: Perez et al. (2015)
The models differ a bit from each other and deliver different answers to the question. The first (SPH1) is a model with a 1 Jupiter mass planet and an extremely high resolution. The second and third (SPH2/3) feature a 5 Jupiter mass planet. Furthermore, SPH1 and SPH2 are using a locally isothermal equation of state. In principle, this means that the gas does not change its temperature at all, which is equivalent to perfect cooling. Physically speaking, this assumes that when the temperature of the gas would rise because of friction or pressure effects, the energy difference is completely and instantaneously radiated away. The SPH3 simulation features an adiabatic assumption, which means that there is no cooling at all and the temperature can rise very much. They use these two extrema (a very cool CPD, isothermal runs, and a very hot CPD, adiabatic run) and from them calculate how this would look like on the sky through a powerful interferometer like ALMA. This is shown in Figure 2.
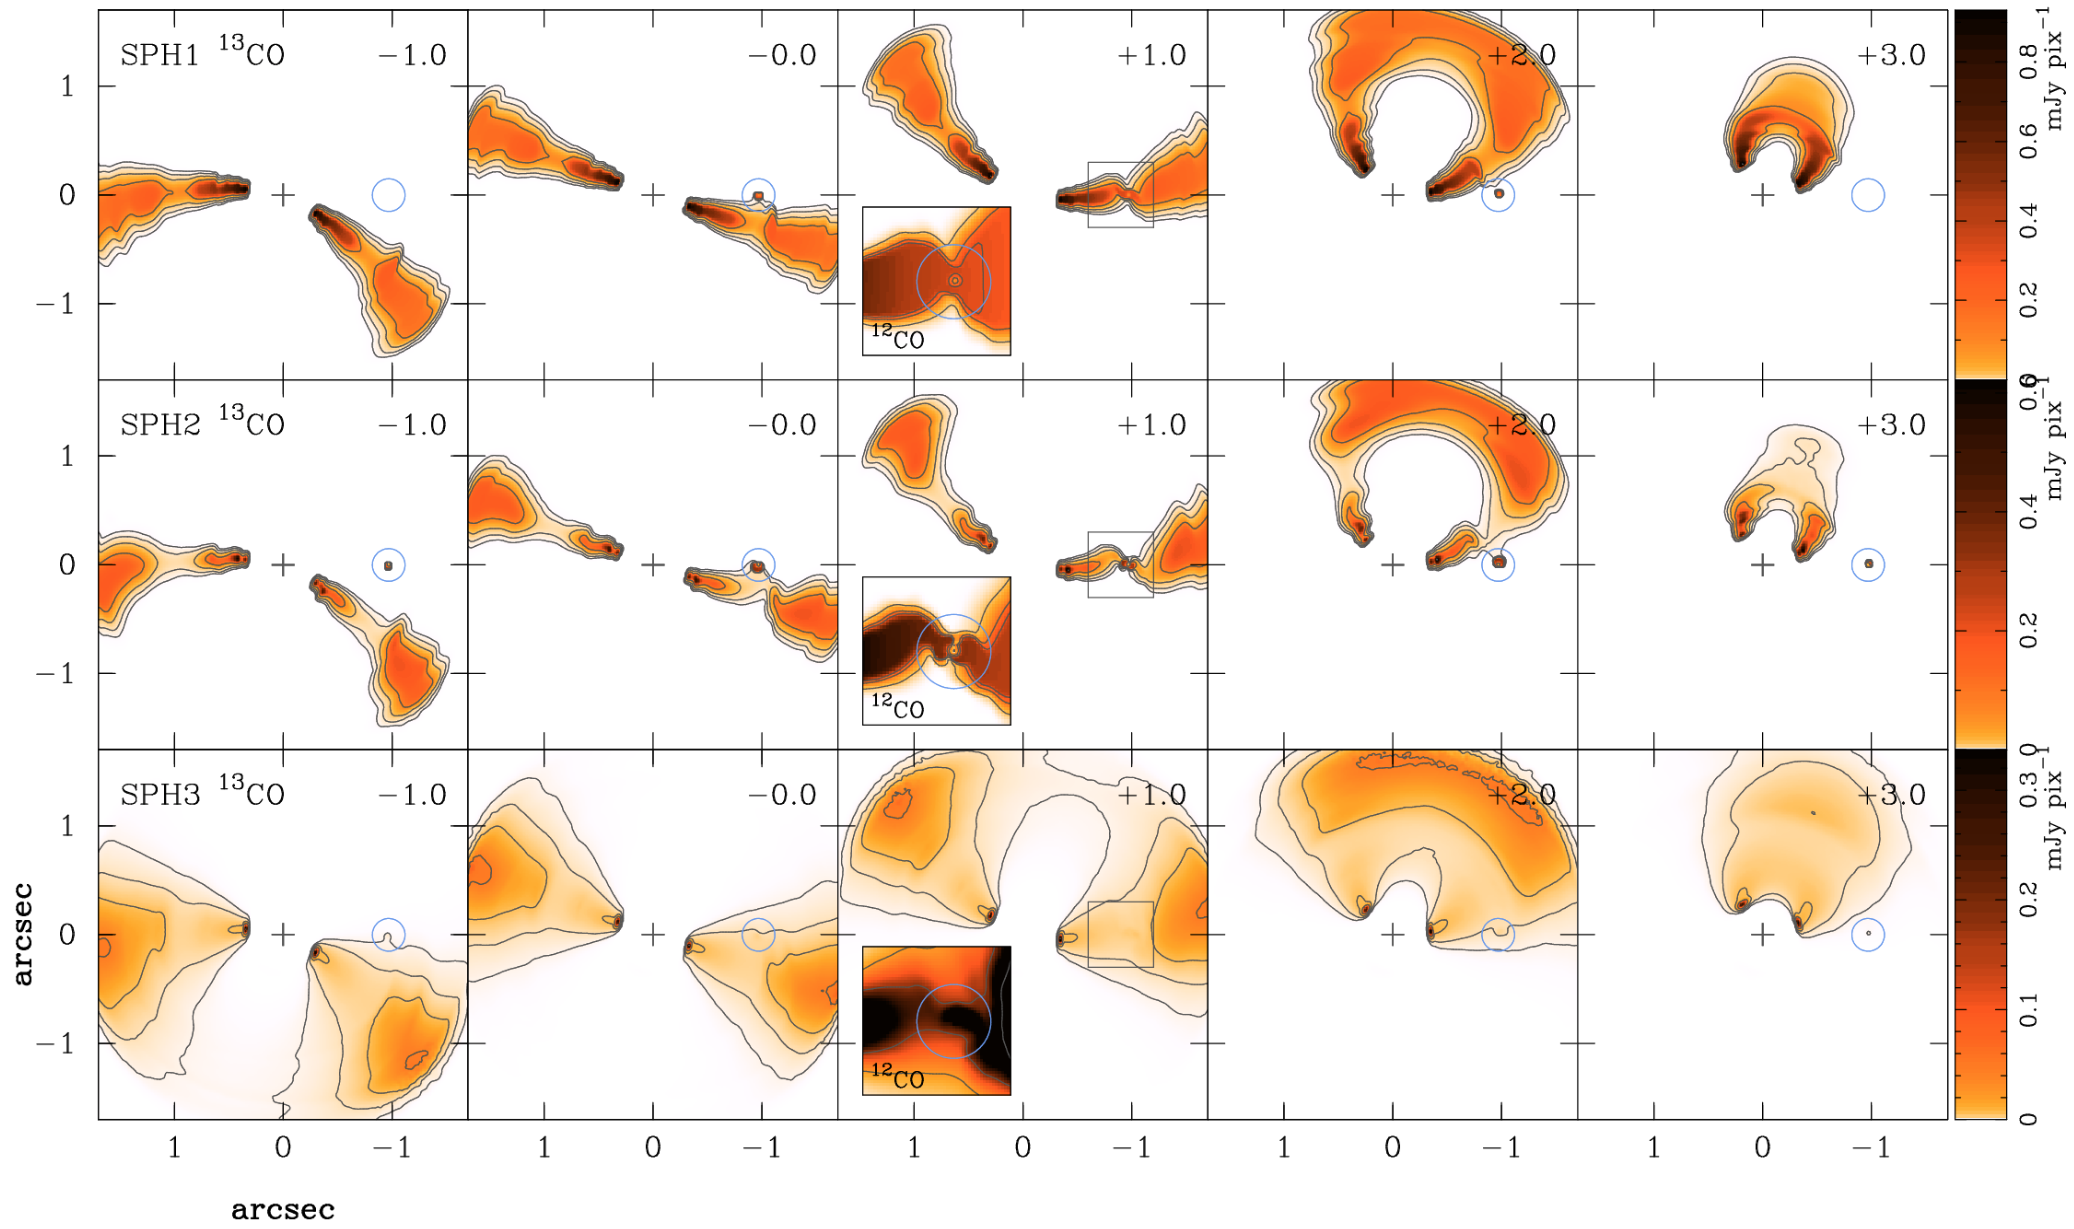
Figure 2: Predictions for measuring the emissions from the [latex]^{13}CO[/latex] isotope, based on the performed simulations. The colouring goes from zero (white) to high (black) emission. Each panel is centered on the star (cross) , shows different components of the disk and has the position of the CPD indicated with a circle. As you can see the CPD can be spotted best for the SPH2 run. Source: Perez et al. (2015)
Can you spot it in REAL data?
As you can see the SPH2 simulation reveals distinct spots at the position of the CPD. A more thorough analysis of the features of the coolest CPD (SPH2 simulation) reveals that for such a model the signal is clear enough that features like this will pop up in data for 1 and 5 Jupiter mass planets for the current capability of ALMA! Of course, there is still work to do to understand the systematics and uncertainties coming from real data. Anyway, the analysis clearly shows that for good circumstances we are well within the detection limits. So, let’s go out and find it…!
Author
Trackbacks/Pingbacks