Title: The Fundamentally Different Dynamics of Dust and Gas in Molecular Clouds
Authors: Philip F. Hopkins & Hyunseok Lee
First Author’s Institution: Caltech
Status: Submitted to MNRAS
Not Just a Nuisance
Cosmic dust, specks made of elements like carbon and silicon, is made during the death throes of stars and is ubiquitous in galaxies. That might sound glamorous, but mention dust to an astronomer and she might look a little queasy. Dust is often a nuisance for astronomers. If you live in a dark place, look up at the Milky Way tonight. That dark lane you see passing through the middle is dust, obscuring our view of the stars and gas that make up most of the Galaxy. Dust is also responsible for crushing the excitement of cosmologists by causing the polarization of radio waves that masqueraded as Nobel-worthy evidence of cosmic inflation.
But dust isn’t just a nuisance. Around newborn stars, dust grains collide with each other and can stick, growing ever larger and eventually forming the seeds of planets. Also, dust is made of heavier elements than the gas in our galaxy, which is almost entirely hydrogen and helium. Stars that form in an area with a lot of dust may be polluted by these heavier elements which can affect how they look and how they live their life. To correct observations for the presence of dust as well as make predictions about planet and star formation, we need to understand how dust behaves.
Today’s paper investigates the evolution of dust in simulations of molecular gas clouds. The authors show that dust behaves very differently from the gas in these clouds, which has important implications for how dust grows and how planets and stars form.
Simulating a Dusty Molecular Cloud
Like the creamer in your coffee in the morning, the molecular gas in clouds like Orion is turbulent. So the authors start with a simulated molecular gas cloud and stir it up to create turbulence. To investigate the effect of the gas motions on the dust in the cloud, the authors simulated dust particles as well. The dust particles simulated range in size from 0.001 to 1 micron, or about the width of DNA to size of a typical bacteria.
The dust particles feel a drag force as they move through the gas, causing their motion to be different from the gas. This can be seen in Figure 1, which shows the filamentary structure of the gas and dust. The inset shows that the dust has a very different structure at smaller scales. The dust traces out much finer details compared to the gas, and some of the dust filaments have no counterparts in the gas at all.
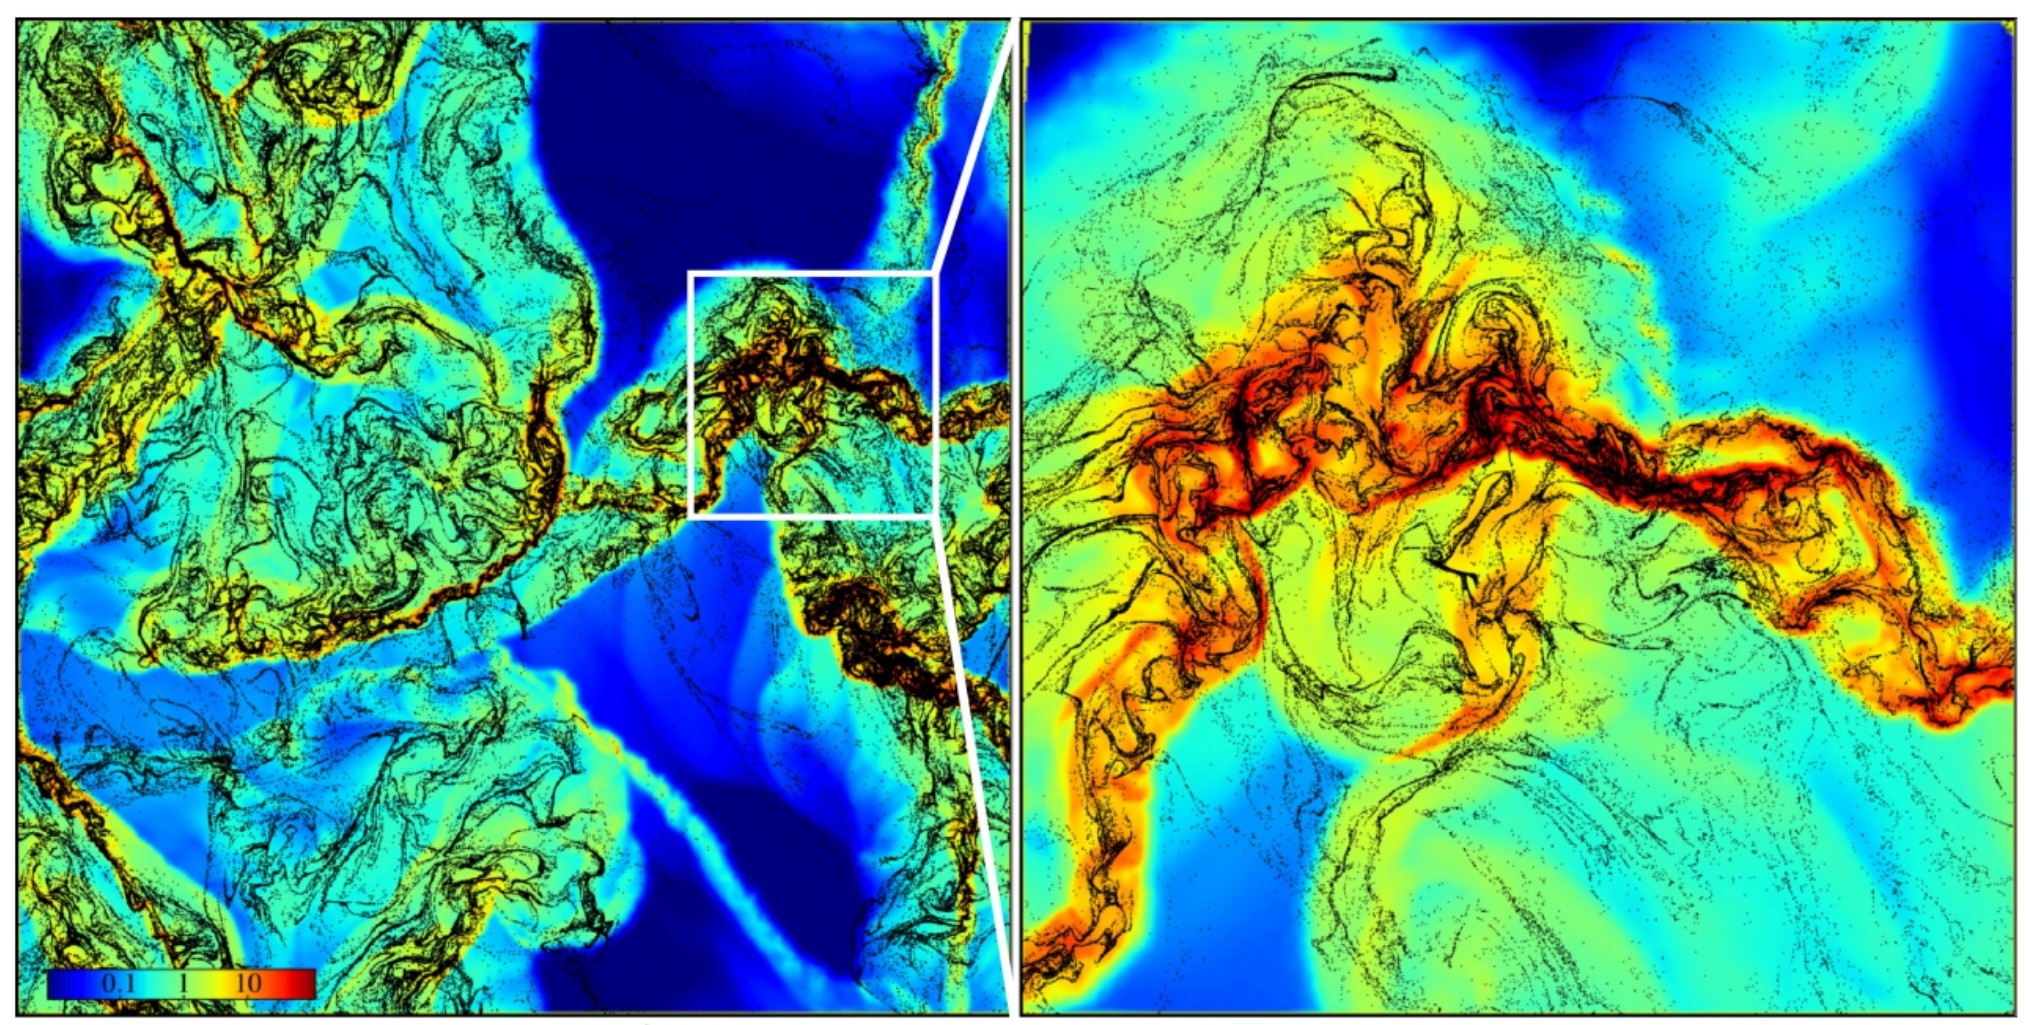
Figure 1. Gas and dust in a snapshot of a simulated molecular cloud. The gas is shown in colors from blue (least dense) to red (most dense). Dust particles are shown as black points. In the 2.5 pc x 2.5 pc box (left) the dust appears to trace the gas. Zooming into smaller scales (right) reveals that the dust forms much finer structures than the gas, and some filaments of dust have no associated gas filament.
Dust does not Follow Gas
Figure 2 shows the effects of the dust grain size on the simulation. Larger dust grains are affected less by the gas. Figure 3 shows how different size dust grains form structure at different scales in the simulations. The largest dust grains are uniformly distributed, while the smallest dust grains follow the gas distribution most closely. The intermediate sized dust grains show the most small scale structure. In these figures, larger grain sizes are indicated by larger alpha values.
In real molecular clouds, we expect a variety of dust grain sizes, so different parts of the cloud will have a different distribution of grain sizes. The wide variation of dust density in the cloud as well as the dependence on dust grain size have important implications for star and planet formation.
Some Implications
Dust is a nuisance because it absorbs and changes the color of light from stars behind it. The large variation dust density means that more or less light will be absorbed in different directions. Different sized dust grains affect light differently, so the grain size dependence shown in Figures 2 will also impact the amount of light absorbed in different parts of the cloud.
Dust grains can grow in size by colliding with their neighbors. The growth of dust grains provides the seeds to form planets, so the enhanced dust density in the filaments seen in Figures 1 and 2 could change the initial conditions for planet formation around stars in these areas.
Stars form from the collapse of the highest density regions of gas in a molecular cloud. The dust in these regions will also fall into the gas. Stars that form in the area of a thin dust filament will inherit a higher abundance of heavy elements from the extra dust. The abundance of heavy elements can have a huge impact on the subsequent evolution of these stars
The main result of this paper is that dust naturally forms very different structures than gas in a simulated molecular cloud, due to the drag force imparted on solid particles embedded in a gas flow. The size of the dust grains plays a crucial role in determining the clustering of this dust. The tantalizing implications of these phenomena for dust growth, planet formation, and star formation will be investigated further in simulations that include these processes.
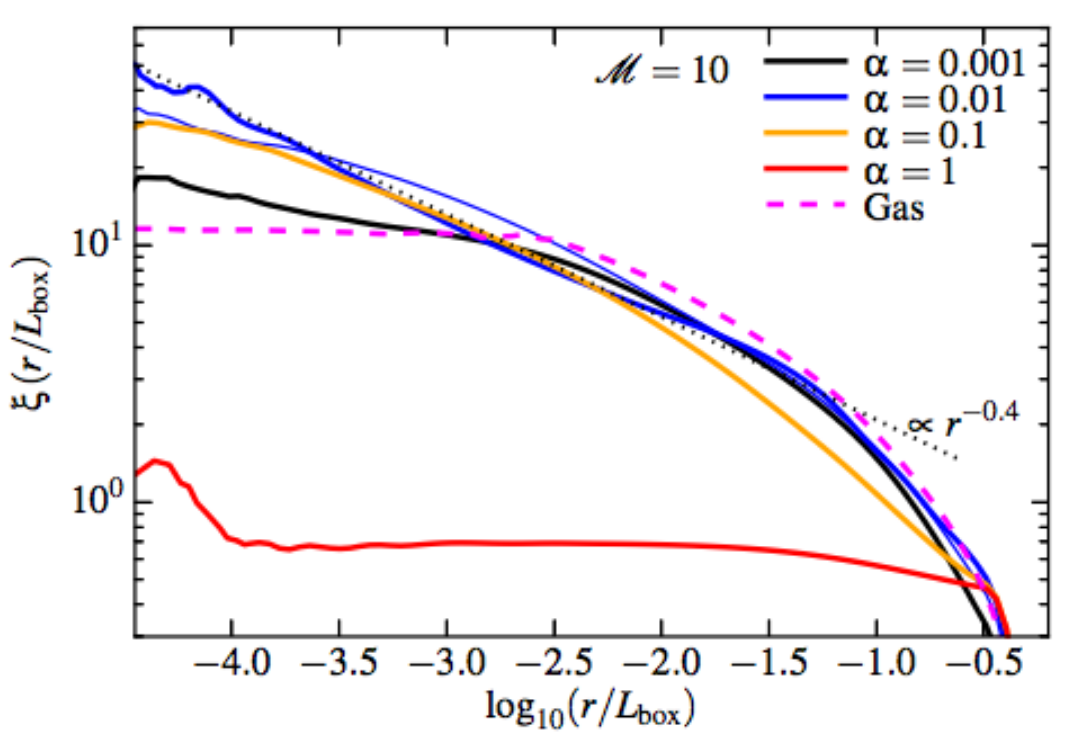
Figure 2. Gas and dust as in Figure 1, but the three panels show simulations with different size dust grains. The smallest grains (top) follow the gas more closely than the largest grains (bottom).
Figure 3: The clustering of dust at various physical scales in the simulated molecular cloud. Pick a random dust grain in Figure 1 or 2. The y-axis represents the average density of dust within a distance of r from the original dust grain. The x-axis represents the variation in physical scale, from the smallest scales (left) to nearly the size of the simulation box (right). The different lines represent a range of grain sizes from the smallest (black) to largest (red). The dashed line shows the clustering of gas. All dust grain sizes follow the gas at the largest scales (right end of the plot). The largest grains (red) have almost uniform density, represented by the nearly flat clustering curve. The smallest grains (black) follow the gas at all but the smallest scales, while intermediate sized grains (blue and yellow) show the most clustering at small scales, seen as the thin filaments of dust in Figures 1 and 2.
Author
Trackbacks/Pingbacks