Title: The influence of non-uniform cloud cover on transit transmission spectra
Author: Michael R. Line, Vivien Parmentier
First Author’s Institution: NASA Ames Research Center
Publication Status: Submitted to ApJ
If you have never watched a video of the fainting goats you must go check it out. When this breed of goats gets frightened, their entire bodies contracts, causing them to fall over onto their sides. Exoplanet scientists have been observed to experience the same exact phenomenon at the sound of one word: clouds.
It may silly, but next time you are listening to a talk about exoplanet atmospheres, raise your hand and ask, “Well, what about clouds?” Just make sure the speaker isn’t standing next to any sharp objects first. The authors of this paper explain why clouds are so scary and what they could do to mess up our observations of exoplanet atmospheres.
Transmission spectroscopy is depicted in Figure 1, below (not from the paper). As a planet passes through the disk of its parent star, some photons from the star pass through the small atmospheric annulus of the planet. With a spectrograph, we can get a glimpse of what the atmosphere is composed of. Meaning, at the end of our observation we might be able to say, “This planetary atmosphere is composed of 99% Hydrogen with 0.5% Water and 0.5% Carbon Monoxide.” The region that Figure 1 shows the starlight passing through is called the terminator region. Transmission spectroscopy only probes the terminator region of the planet.

Transmission spectroscopy explained in one image. Some photons from the star make it through the small limb of the planetary atmosphere. If we take a spectrum of these photons, we can get a glimpse of what the atmosphere is made of. Image credit: A. Field, STScI /Batalha PSU
This method works so long as some photons from the star can make it through the terminator without getting absorbed or scattered by the planet. And as you might guess, clouds have the ability to block photons from passing through the terminator. If the clouds are so thick that no photons make it through that terminator, the astronomer observes a flat spectrum (see extensive discussion of GJ 1214b). This is the worst-case scenario and it is the reason clouds are a source of many headaches.
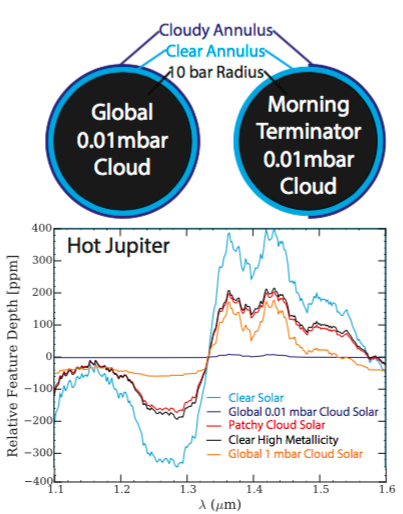
Instead of a blanket of clouds, the authors of today’s paper have modeled planetary atmospheres with different variations of cloud coverage ranging from fully cloudy, to partially cloudy. In the partially cloudy case, some of our photons might be obscured but some might make it through. The authors model the transmission spectrum of five different scenarios in Figure 2 below.

Transmission spectra of five different cloud configurations. The blue shows the case where the planet has no clouds, the purple shows the case of high-altitude global cloud coverage. The red and the black are perhaps the most interesting cases. The red is a partly-cloudy case, while the black has a completely different composition but with no cloud coverage. Main point: clouds can make us misinterpret the atmospheric composition of exoplanets.
The two most extreme cases are the light blue (global clear skies) and the dark purple (global high-altitude clouds). If our planet were to have clear skies, the absorption features are quite large. On the other hand, if we have high altitude clouds obscuring the entire atmosphere, we end up with a flat spectrum.
The next most interesting case is the orange line (global low-altitude clouds). Low altitude clouds (opposed to high-altitude clouds) act as a partial cover to the atmosphere. You can imagine it being the difference between me throwing a sheet over my head, and me throwing a sheet around my waist. In one case, I disappear completely (at least to a 3 year old) and in the other case, I am half there. Looking at the orange curve, you can see it has the same approximate shape as the blue but it has been damped considerably.
Moving on to the red and the black curves, you will notice they look nearly identical. This is where it gets messy. The red curve is what you might observe if part of of your planet was covered in clouds and part was clear. The black is a model of a completely different atmospheric composition with clear skies. Yet, the red and the black are practically indistinguishable. Cue the fainting goats…
At the beginning of the bite, I said that the sole reason for doing transmission spectroscopy was to determine the atmospheric composition of the planetary atmosphere. The authors have shown that clouds can trick us into determining one composition, when we are really looking at something different.
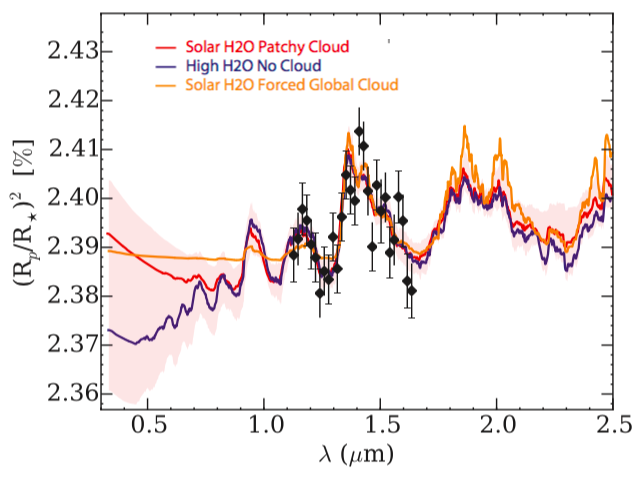
But how does this stack up against actual observations? Have we already begun to misinterpret observations of exoplanet atmospheres? HD 189733b is a Jupiter sized planet orbiting its parent star once every 2.2 days. Because it is around a bright star and because it is so large, it is possible to get relatively precise transmission spectroscopy. For this reason, HD 189733b is probably the most well characterized planet. Take a look at Figure 3, below.

The black dots are real observations of HD 189733b. The three models show completely different configurations of clouds coverage. The red and the orange have the same atmospheric composition but the red has patchy clouds and the orange has global low-altitude clouds. The purple is a completely different atmospheric composition but with no clouds. Main point: all three models fit the data
Here we have observations of HD 189733b in the black circles. The red, purple and orange are different models (as described above). Within the errors, all three models fit the data we have observed. Notice that there are no observations shorter than 1 micron. However, this is the regime where the models start to diverge. It is possible that this is a key region for observing exoplanet atmospheres. The authors postulate that this could be the region that breaks the degeneracies introduced by the clouds.
In the end, all hope is not lost and we can put away the fainting goats!! There will be regions of wavelength space where we can get around the mess that clouds make. But this does showcase the importance of measuring a large region of wavelength space. This will be absolutely crucial in planning all observations of exoplanet atmospheres with the next generation of space and ground based missions.


A very interesting bite, Natasha, many thanks. Not only was the subject paper useful to read about, but it was helpful to have the link to Earth magazine’s article about the Terminator zone (I’ve bought two Earth mag ebooks mentioned in a side bar there before coming back to this astrobite!) And I do so hope that I get the opportunity sometime to see if an exoplanet researcher responds like a fainting goat when asked about clouds 🙂