Title: Maps of Evolving Cloud Structures in Luhman 16AB from HST Time-Resolved Spectroscopy
Authors: Theodora Karalidi, Daniel Apai, Mark S. Marley, Esther Buenzli
Lead Author’s Institution: Steward Observatory, University of Arizona
Status: Accepted to ApJ
I might get angry comments for this – but stars are pretty simple. The Vogt-Russell theorem says that from just the mass and chemical composition, we can calculate the radius, luminosity and structure of the star. In other words, just a few parameters tell us almost everything about the star. The first brown dwarf discovery was in 1988 and the first exoplanet discovery in 1992, and it’s quickly become clear that the rule of simplicity no longer applies here: as we move to the regime of planets and brown dwarfs, temperatures are low enough to allow condensation to happen, and clouds are expected to form. Recent measurements of variability in the brightness of brown dwarfs has suggested that these clouds really are present – and that they are complicated, blocking some but not all of the surface radiation and moving across the brown dwarf surface between observations (so called “variability of variability” is now measured!). We don’t even understand clouds on Earth, and astronomers studying them on exoplanets have an even harder time. Clouds, and astronomers’ less-than-keen reactions to them, have been discussed here on astrobites before by Natasha Batalha.
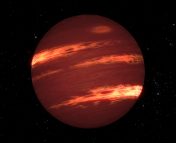
One of the reasons that clouds are so hard to understand outside our solar system is that we don’t stand a chance of imaging them directly. To resolve, or directly see, distinct features on a 1 Jupiter radius planet at a distance of 2 parsecs or so in the near infrared, a telescope would have to have a diameter >7km – the E-ELT, the biggest ever optical/infrared telescope project due to be completed in 2025 with a diameter 39m, doesn’t even get close. And yet, today’s paper is one of the first to attempt to map cloud positions. Specifically, the authors look at the atmosphere of the nearest known brown dwarf binary system to Earth: Luhman 16A&B, a brown dwarf binary system at 1.998pc, with temperatures ~1310K and ~1280K respectively. At these temperatures, complex molecules like Mg2SiO4 and Na2S start to form and condense out of the atmosphere. This leads to an atmosphere rich with molecular species, and very complex to study! In addition, both of these brown dwarfs have previously been shown to be highly variable: perhaps this is a sign that there might be complex cloud systems present, modulating the brightness. When these two dwarfs were discovered in 2013, they were detected as a single point, but various observations have now spatially resolved the two dwarves from each other.
To understand these atmospheric features without a 7km telescope, the authors use a previously published light curve taken with HST in the near-infrared. The light curves simply measure the brightness of the brown dwarfs and their variations with time, and in this case the data lasts ~1.4 full rotations of the brown dwarfs. The authors apply their own MCMC modelling procedure to the data. If you don’t know what this means, Benjamin Nelson has written a great introduction to MCMC & Bayes, but basically you repeatedly make random changes to your model, see if it fits the data better or worse than before, and either keep it or scrap it. In this case, the model consists of several elliptical shaped spots, against a uniform temperature background. Figure 1 shows the original light curve HST produced, and the inferred surface brightness map that the authors infer for Luhman 16B. A total of three spots are found, at ~230K warmer than the body of the planet.
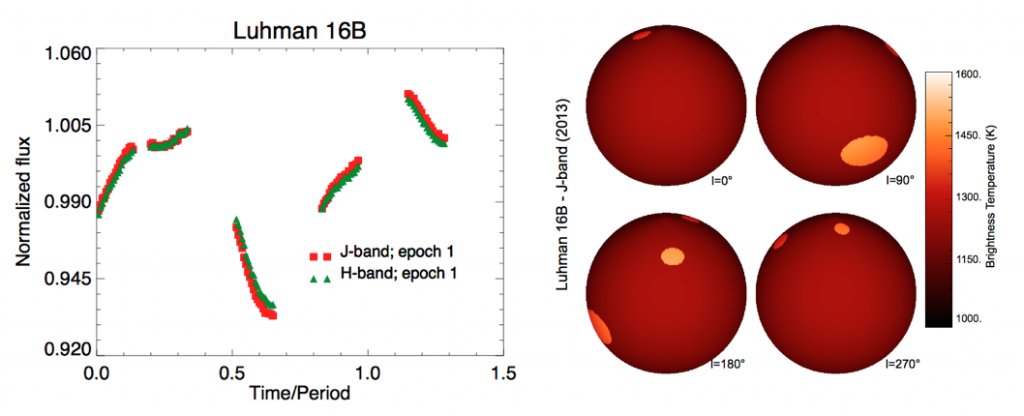
Figure 1: On the left is a light curve for the brown dwarf Luhman 16B, at two near-infrared wavelengths, the J and H bands, in the same observing epoch. The right hand side shows the authors’ retrieval model of the variable temperature regions, namely three bright circles roughly 230K hotter than the brown dwarf.
It is important to note that these patches are likely not “cloudy” vs “clear” sections, but rather are varying cloud consistencies and thicknesses, allowing more or less of the deep atmosphere’s warm emissions through.
One interesting finding, based on the light curves from a whole series of observations across more than a year, is that there is a relatively consistent “trough” shaped feature, across several observations. I’ve included this data as my Figure 2. The authors discuss possible sources of this. First they test for a possible exoplanet, but this doesn’t fit the data. Instead, they suggest either a Jupiter-like “red spot”, or a common atmospheric structure that repeatedly reappears at the surface.
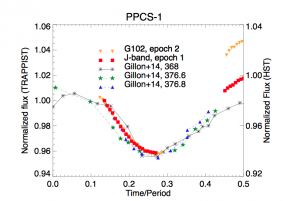
Figure 2: A consistent trough is observed in several observations – the authors suggest this may be caused by a Jupiter-like “red spot”.
Another consequence of this work is that the wind speed on the brown dwarfs can actually be measured! To do this, the authors assume that the maximum possible spot size is defined by the atmospheric jets, and as such derive the wind speed as either 600m/s or 800m/s for Luhman A, and between 810m/s and 970m/s for Luhman B. These speeds are faster than the winds on giant planets in our own solar system, but slower than the winds on highly irradiated hot Jupiters, and so certainly seem plausible. The wind speed measurement is a pretty cool result, given that each brown dwarf can only be seen as a single, unresolved point on the sky!
For the moment this technique is very new, and is still restricted to the nearest few brown dwarfs, and the brightest few exoplanets. Even measuring the clouds on a double star is a big step forwards though, and as telescopes get larger and more powerful this exact method may end up helping us understand the weather on planets just like our own Earth, orbiting nearby stars!

Trackbacks/Pingbacks