Title: Stellar disk destruction by dynamical interactions in the Orion Trapezium star cluster
Authors: Simon F. Portegies Zwart
First author’s institution: Leiden Observatory
Status: Submitted to MNRAS
Stars form when clumps of gas collapse under their own gravity. The angular momentum of the collapsing gas is conserved and collisions among gas particles cause the clump to flatten into a disk. This disk is the birthplace of planets. Here, microscopic grains of dust stick together, forming pebbles, boulders, and eventually planets and moons. This is the basic picture of solar system construction.
Complicating matters, most stars are formed in densely packed stellar clusters. Within young clusters, newborn stars can make close passes with each other. If two stars encounter each other, each disk may be disrupted by the gravity of the other star. These encounters can result in both stellar disks being truncated as the outer disk is destroyed while the inner disk remains bound to its star. The effect of many stellar encounters is reflected by the distribution of disk sizes in the cluster. For the nearest clusters, these protoplanetary disks can be imaged directly and their sizes measured.
Using simulations of such stellar encounters, today’s paper attempts to constrain the size, shape, and age of the Trapezium cluster in the Orion Nebula by comparing the measured and simulated disk size distributions.
Simulating Disk Destruction
The study starts with a standard N-body simulation to track the motions of stars within a star cluster under the influence of gravity alone. Each star is given a disk with a radius of 400 AU, the maximum size observed in the Trapezium cluster. The disks do not affect the simulation at all unless two stars pass close by each other. If two stars approach within 0.02 parsecs of each other, the N-body simulation is paused and the disks are disrupted according to a simple model.
There are two factors that determine the radius at which a disk is cut off by a close encounter with another star. The first is the mass ratio of the two stars. The more massive star exerts a stronger gravitational pull on its disk which will only be disrupted at its outer reaches. The disk around the less massive star will be truncated at a much smaller radius. The second factor that affects the cutoff radius of the disks is just how close the encounter is. The closest pass between the two stars is computed using Kepler’s Laws. The closer the encounter, the smaller the remaining disks.
As the cluster simulation runs an increasing number of stars experience close encounters, and the total distribution of the disk sizes in the cluster changes as disks tend to shrink. The simulated disk size distribution is then compared to the measured distribution in the Trapezium cluster.
The Trapezium cluster
The Trapezium cluster in the Orion Nebula is close enough that protoplanetary disks can be directly imaged. From these images, the distribution of disk sizes is measured. In order to use the distribution of disk sizes from the simulation to constrain the size and shape of the Trapezium cluster, the author used several different initial cluster configurations in the simulation. Figure 1 shows the initial state of the simulated cluster for four different stellar distributions.
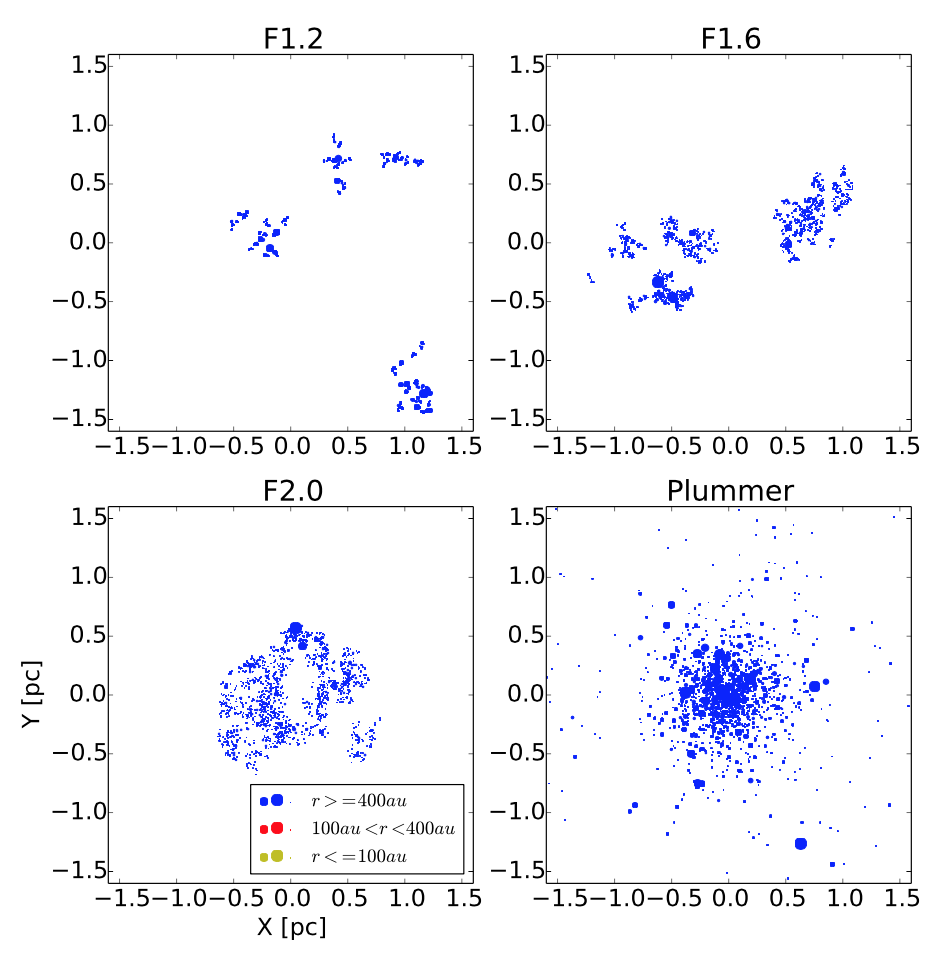
- Figure 1. Initial simulation snapshot of 4 different cluster geometries – three clumpy distributions and one spherical Plummer distribution. Each point is a simulated star. The color of the points indicates the size of their disks. All stars are initially assigned disks of 400 AU.
As well as the initial shape of the cluster, the overall size and number of stars is varied. Each initial cluster is then simulated to see if and when the disk size distribution matches that of the Trapezium. Figure 2 shows the same clusters as in Figure 1, but at an age of 300,000 years. The figure shows that the clumpy clusters result in much more efficient disk destruction than a spherically distributed cluster.
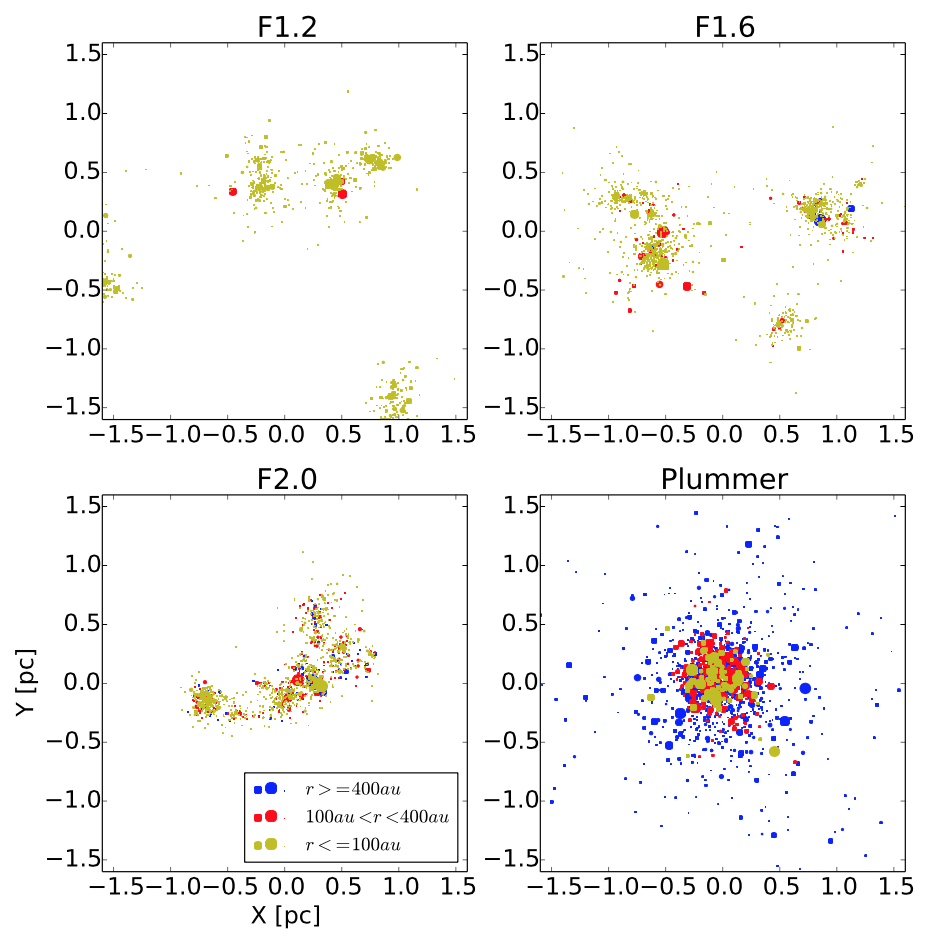
- Figure 2. The same 4 clusters as in Figure 1, this time after evolving for 300,000 years. Many stars have now had close encounters, disrupting their disks. The colors of the points indicate the size of the disk around each star. The Plummer cluster contains too many disks which have not been disrupted (black points) compared to the observations.
Figure 3 compares the distribution of disk sizes in sample simulation runs with the observed distribution in the Trapezium cluster. The best match comes from the simulation (black line) with a moderately clumpy cluster, a radius of 0.5 pc, and 2500 stars at an age of 300,000 years.
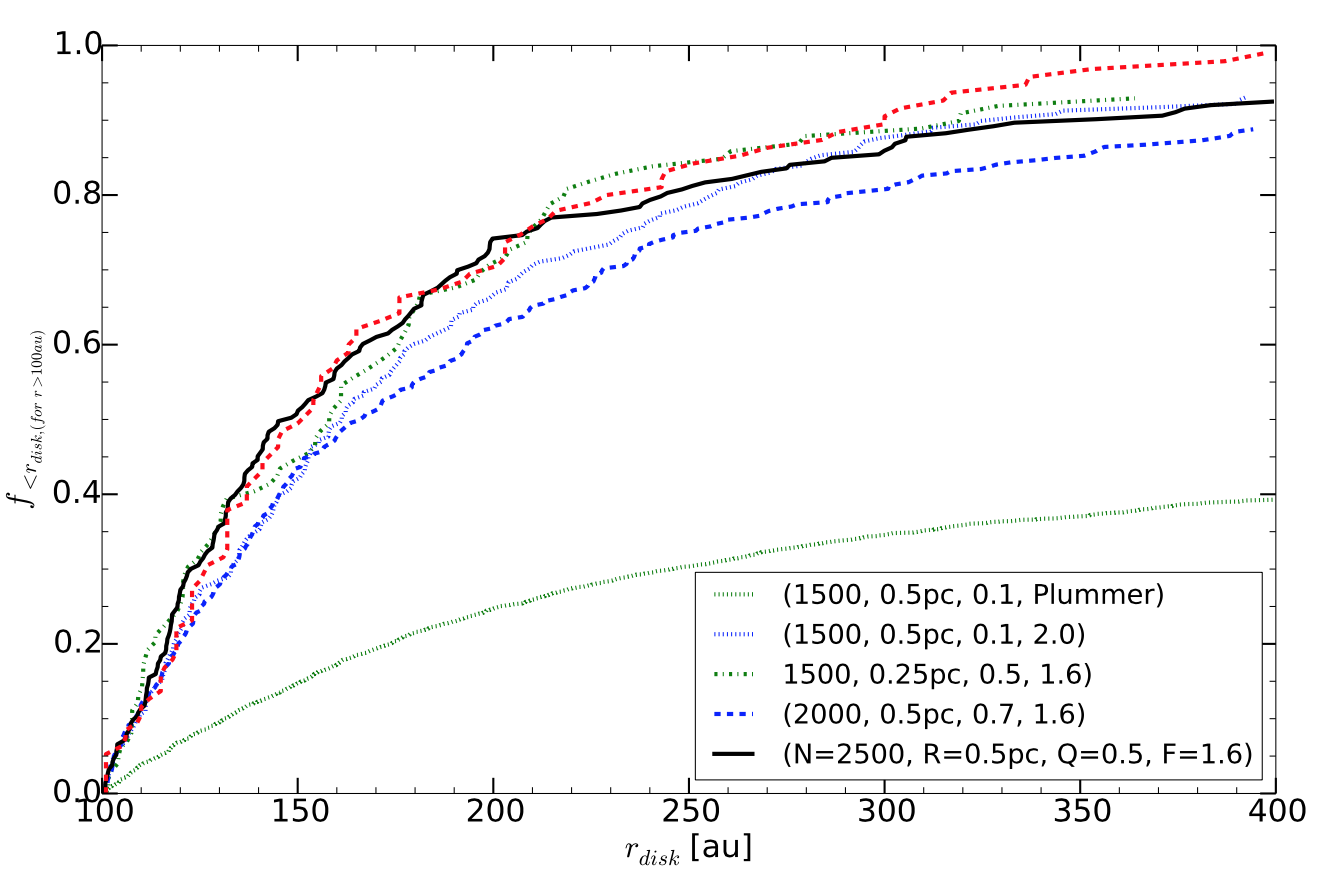
- Figure 3. Disk size distribution in simulations compared to observations. The red curve shows the measured sizes. The legend indicates the number of stars, the size, the virial parameter, and the density profile of the simulated clusters. The black curve is the best match to the observed distribution.
Conclusions
The observed disk size distribution of the Trapezium cluster can be qualitatively matched using the author’s simple implementation of disk disruption in close encounters. Disks are undoubtedly affected by other processes too, like stellar evolution and the left-over molecular gas in the surrounding cloud. But because the simulated disks must match the Trapezium disks in size, the size, shape, and age of the Trapezium cluster can all be estimated, and certain situations – such as an initially spherical star cluster – can be ruled out entirely.
A further implication of the ubiquity of close stellar encounters is that almost all the stars must have traded some of their original disk material with others. This means that our own solar system may contain objects stolen from another star’s disks while the two were embedded in a similar cluster just after birth. The authors point out that the distant minor planet Sedna could be a candidate for such a theft.
Author
Dear Jesse,
thank you for this great post!
I have just one question regarding Figure 3. I didn’t quite understand what is shown on the y-axis.
Does the number indicate the percent of the stars which have disks smaller than the value on the x-axis?
For example (looking at red line), ~50% of the stars have disks smaller than ~150AU?
Thank you for your time.
Regards,
Andrija