TITLE: Exploring the mass assembly of the early-type disc galaxy NGC 3115 with MUSE
AUTHORS: A. Guérou, E. Emsellem, D. Krajnović, R.M. McDermid, T. Contini, and P.M. Weilbacher
FIRST AUTHOR INSTITUTION: Institut de Recherche en Astrophysique et Planétologie, University of Toulouse
STATUS: Accepted by Astronomy & Astrophysics
In today’s trip to the menagerie of galaxies, we’ll be visiting NGC 3115, a nearby (a mere 32 million light-years distant), somewhat unusual galaxy sometimes called ‘The Spindle’ (although – in a brilliant demonstration of the imaginative nature of astronomers – at least one other galaxy, NGC 5866, has the same name … so we’ll stick to NGC 3115). This galaxy is the nearest S0 (pronounced ‘Ess-Zero’) galaxy to us. An S0, or `lenticular’ galaxy is a strange hybrid of the more famous spiral-type and elliptical-type galaxies. For more on this, see the Astrobites Guide to Galaxy Types, or indeed (if I can include a shameless plug) the first few paragraphs of a previous article, How to Grow a Galaxy. If you’ve ever seen the famous ‘Hubble tuning fork’ diagram (see Figure 1), you’ll know that S0’s live at the end of the ‘handle’.
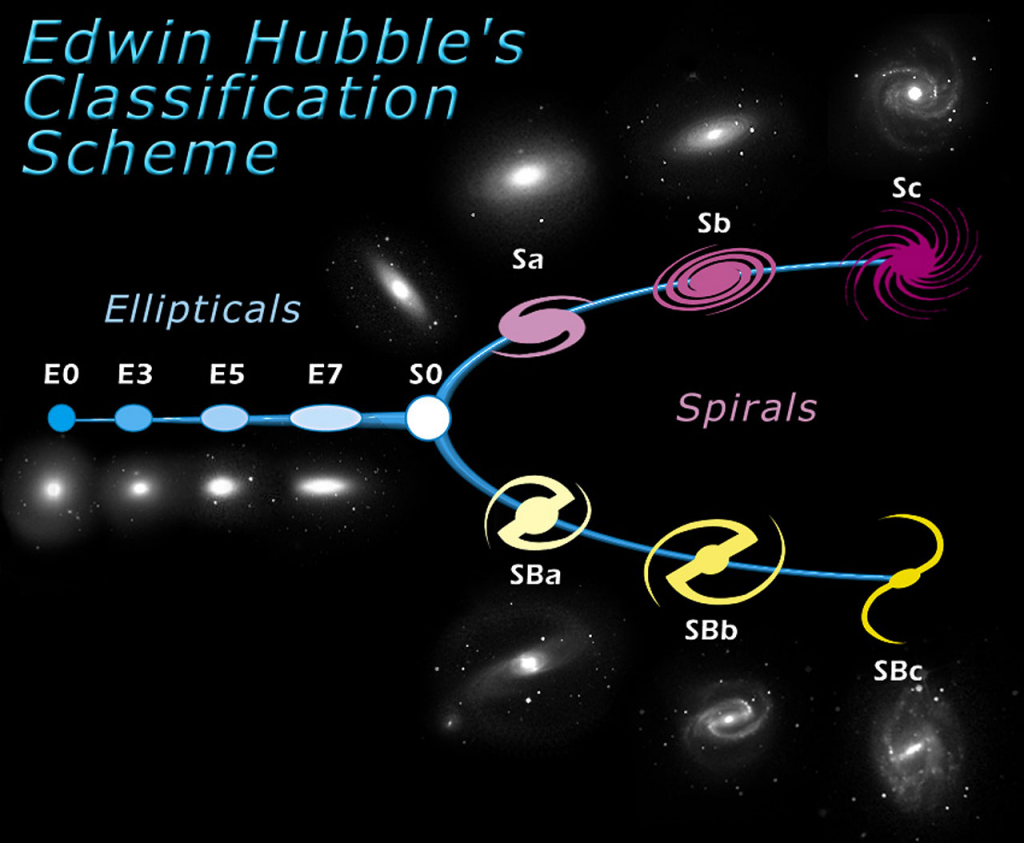
Fig. 1: The Hubble ‘tuning fork’ diagram of galaxy types. S0s/Lenticular galaxies are a halfway-house between the spirals and the ellipticals (image credit).
What makes these galaxies special? Well, in the current theory of galaxy evolution they represent the end of the line for spiral galaxies like our own Milky-Way. They look a bit like spiral galaxies, with a thin disc of material surrounding a central bulge (a bit like a pair of fried eggs stuck back-to-back…), but lack the prominent spiral arms and ongoing star-formation that are typical of spiral-type galaxies. Like the ellipticals, they are ‘red and dead’ with an aging population of red giant and red dwarf stars and no star formation (usually). What we’re seeing is a spiral galaxy which has used up or lost all its spare gas, but which hasn’t been involved in some kind of violent collision with another galaxy (which would have destroyed the delicate disc structure and left a classic elliptical galaxy): it’s the galactic equivalent of an aged retiree.
NGC 3115 is not only nearby, it’s also nearly edge-on (we’re looking sideways at the thin disc, rather than seeing it from above). This makes it ideal for studying the motion of the disc, for reasons which will become clear. It’s an interesting galaxy in a number of other ways, with sharply defined structures and a supermassive black hole with the mass of a billion suns. As such, it makes a spectacular target for the superb MUSE instrument (that’s the Multi Unit Spectroscopic Explorer) attached to the VLT (Very Large Telescope … but I’m sure whoever named it was being ironic. Surely no-one’s that unimaginative?). MUSE is, quite simply, breathtaking in its ambition, giving astronomers the ability to map vast regions of the sky in reasonable resolution, but more importantly yielding a detailed spectrum at every single pixel. Point it at a galaxy like NGC 3115, and if it can’t tell you everything you need to know about it, nothing can (we’ve featured MUSE data before). Today’s paper uses data from the instrument’s commissioning run, meaning it’s really an opportunity to showcase the instrument’s abilities.
So how, exactly, does MUSE tell us so much? The key is in the spectra – the measurement of how much light is emitted at at any particular wavelength. Galaxy spectra are the sum of the light from all the stars in the galaxy, or in this case covered by a single MUSE pixel (because it’s so close, NGC 3115 is about 1000 pixels across, so this gives a pretty impressive resolution). Individual features in the spectrum – absorption lines, for example – will be shifted from their expected wavelengths by doppler shift (see e.g. this explanation). Because stars in one part of the disc will be moving towards us and the stars in the other half will be moving away (after we subtract off the motion of the galaxy’s centre of mass, anyway), this means we can measure the wavelength of those features in each pixel to figure out how fast the disc is rotating (this is why it was important to find an edge-on disc). But wait, there’s more! Within each pixel, some stars will be moving away from us and others will be moving towards us, so sharp, narrow features in the spectrum get broadened when you add the light from all those stars together. In a small pixel, this motion has much less to do with the rotation of the galaxy, and much more to do with the random motions of the individual stars. If the galaxy is nicely ordered (as in spiral galaxy arms), the stars in a small region all move in lockstep, and so the features are narrow. If their motions are chaotic (as in elliptical galaxies) the features are broad. We call this velocity dispersion (literally just the spread of velocities), and it can tell us a lot.
One way to think about this is that the galaxy spectrum is like a star’s spectrum combined with a Gaussian function, a.k.a. a bell curve (better get used to the fact that those crop up everywhere) that describes the distribution of stellar velocities in a pixel. The mean value (where the bell curve peaks) tells you the velocity shift, and the variance (the width of the bell curve) tells you about the velocity dispersion. Now, it turns out you can go one step further and modify the Gaussian by stretching one side (skewing it), or flattening the top – doing this has a real physical meaning, and we can measure the skewness (which will turn out to be important in NGC 3115) and the kurtosis (the flattening – which isn’t so important, but which I include just so I can write ‘kurtosis’).
The authors measure these four things in every single pixel and produce the maps shown in Figure 2. The top panel shows the rotation of the disc; the second shows that the disc is very nice and ordered, while the core of the galaxy is chaotic; the third shows that the stellar motions are skewed in the disc, which actually tells us that this disc is embedded in a diffuse sphere of stars which doesn’t rotate as quickly as the disc. More subtly, right in the middle the map makes a ‘butterfly’ shape above and below the disc — the skewness reverses. The authors suggest this might be a sign of a breakdown in the disc into a central bar structure (see this for why that’s interesting; googling ‘galaxy bars’ will get you nowhere, I can tell you). Oh, and the bottom panel is the kurtosis. Which tells you nothing.
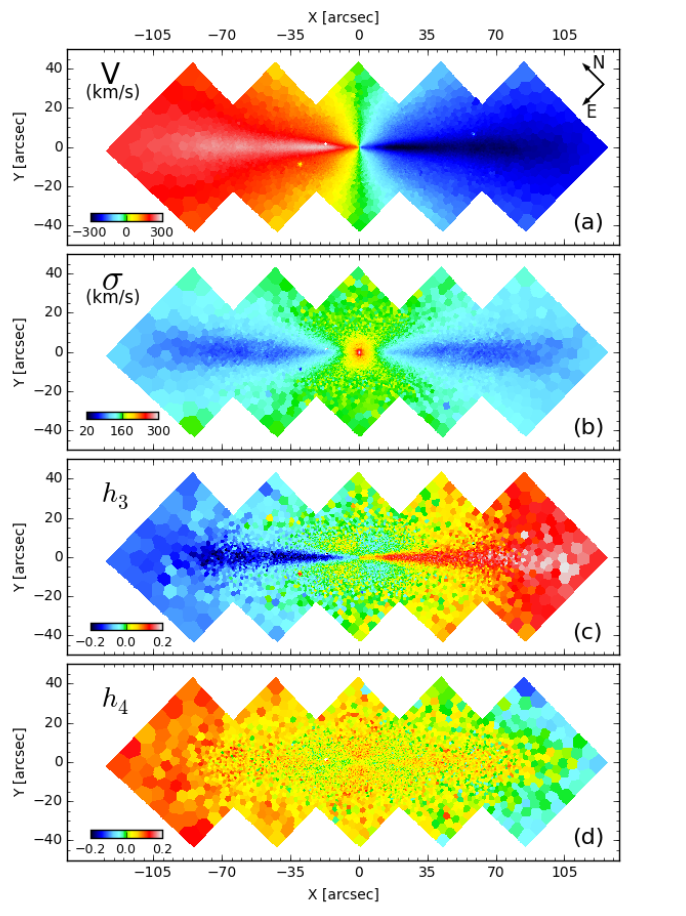
Fig. 2: The four panels (from top to bottom) show us the velocity, the velocity dispersion, the velocity skewness, and the velocity kurtosis (don’t worry about that one) respectively. The bands stretching left and right are the galaxy disc, while the central blob is the galaxy bulge (Fig. 3 from the paper).
Moving on, there’s quite a bit more that spectra can tell you. Instead of using the spectral features to probe stellar motions, they can also be used to tell you something about the other properties of the stars. For example, some features are only strong in young stars, so their strength in a given pixel tells you how many young stars are in that pixel. Using a few different features can get you reasonably precise age estimates (i.e. you can work out how long ago the stars in a pixel were formed, on average). Other features are sensitive to the metallicity, which just means the amount of elements other than hydrogen and helium that are found in the stars (that’s right – everything else is a ‘metal’ to an astronomer). This nets you Figure 3, the top panel of which is a map of the stellar ages (it neatly shows that the disc is relatively young (only nine billion years old!) while the bulge formed its many, many stars early in the life of the universe. Meanwhile, the bulge is clearly rather chemically enriched, whereas the stars in the disc are more similar to our own sun. This distinction between the stars in the bulge and the disc is typical of spiral galaxies, so seeing it in a lenticular galaxy supports our picture of these as aged spirals.
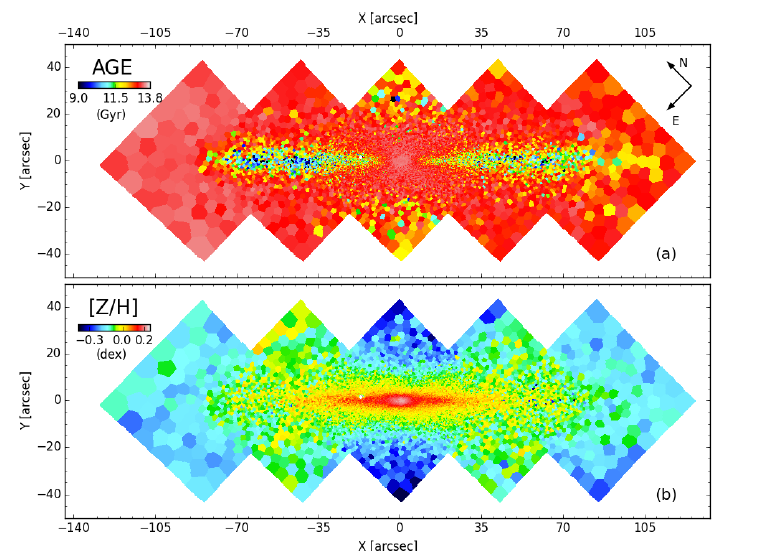
Fig. 3: The top panel shows how old the stars in the galaxy are, demonstrating that the disc is relatively young. The bottom panel shows how chemically enriched the different parts of the galaxy are, clearly showing that the bulge is quite distinct from the disc (Fig. 5 from the paper).
In summary, we are entering a golden age of astronomical observation, with lots of high-quality detailed data available. With instruments like MUSE we can learn more about the universe than ever before. In particular, the sheer level of detail in the data is precisely what we need to get enigmatic galaxies like NGC 3115 to spill their secrets.
Author
Trackbacks/Pingbacks