Title: Pulsation-Triggered Mass Loss From AGB Stars: The 60-Day Critical Period
Authors: Iain McDonald and Albert Zijlstra
First Author’s Institution: Jodrell Bank Centre for Astrophysics
Status: Accepted to ApJ Letters
Background
Perhaps you’ve heard that four billion years from now, the Sun will grow into a red giant with a radius the size of Earth’s orbit before eventually shrinking into a white dwarf about the size of Earth itself. Besides being very small, the resulting white dwarf will probably only have half of the original mass of the Sun. Where does that lost mass go?
Figure 1: An HR Diagram showing the main sequence, red giant branch, horizontal branch, and asymptotic giant branch. The horizontal axis indicates the temperature, while the vertical axis indicates the luminosity. The arrow traces out the path the star would take after leaving the main sequence. From http://www.astronomy.ohio-state.edu/~pogge/ .
During a star’s post-main-sequence (MS) evolution, it will lose much of its starting mass through stellar winds. Currently, the Sun is constantly losing mass through solar winds—material that is being ejected from its surface—but when the Sun leaves MS and reaches the red giant branch (RGB), these solar winds will become even stronger. After the end of the RGB phase, the Sun will continue to evolve until it reaches the asymptotic giant branch (AGB)—so named because it will then asymptotically approach the same location on the Hertzsprung-Russell diagram that it does as an RGB star (see Figure 1 for an example). AGB stars have even stronger stellar winds, meaning they are losing mass at an even more rapid rate than RGB stars. It is thought that much of a star’s mass loss happens when it is on the RGB and AGB. In addition, all of this excess material being blown off of the star means that AGB stars are often surrounded by a lot of dust.
Exactly what really drives this process, however, is not something that we understand very well. Today’s astrobite discusses some of the possible mechanisms for stellar mass loss in AGB stars, particularly the role that pulsation plays in mass loss.
Stars can pulsate in a variety of different pulsational modes. The fundamental mode is probably what you imagine when you think of stellar pulsation—all of the star is moving radially in the same direction. However, if the star has radial nodes, different parts of the star move in different directions at the same time (sort of like the nodes of an pipe). We call these pulsational modes overtone modes, and the type of overtone mode (first, second, third, etc.) tells you the number of nodes that exist in the star.
Mass Loss above the 60-Day Critical Pulsational Period
![Figure 2: Figure 1 from the paper, which shows the dust excess (given by K-[22] color) on the vertical axis plotted against period in days on the horizontal axis. The dotted horizontal line marks the authors' criterion for 'substantial dust excess'. The red circles show period data taken from Tabur (2009), the green squares from the International Variable Star Index, and the blue triangles from the General Catalogue of Variable Stars. Smaller light blue triangles indicate the stars for which they had GCVS data, but could not detect with Hipparcos. Starting at a period of 60 days, there is an increased number of stars with greater dust excess than their criterion. There is another increase at about 300 days.](https://astrobites.org/wp-content/uploads/2016/06/Screenshot-2016-06-08-11.48.54-1024x581.png)
Figure 2: Figure 1 from the paper, which shows the dust excess (given by K-[22] color) on the vertical axis plotted against period in days on the horizontal axis. The dotted horizontal line marks the authors’ criterion for ‘substantial dust excess’. The red circles show period data taken from Tabur (2009), the green squares from the International Variable Star Index, and the blue triangles from the General Catalogue of Variable Stars. Smaller light blue triangles indicate the stars for which they had GCVS data, but could not detect with Hipparcos. Starting at a period of 60 days, there is an increased number of stars with greater dust excess than their criterion. There is another increase at about 300 days.
Most previous studies of the effects of pulsation on mass loss have focused on stars with pulsational periods greater than 300 days, because both observation and theory have shown that to be when stars have the greatest dust production and highest mass-loss rate. However, a less-studied 60-day ‘critical period’ in the increase of dust production has also been noted as well.
Mass-loss in RGB and AGB stars seems to increase at a period of 60 days. Both RGB stars and AGB stars can pulsate (in fact, there is evidence that all stars pulsate…if only we could study them well enough to see it), but the authors find that despite inhabiting roughly the same area on the HR diagram, the 60-day period stars with strong mass loss appear to only be AGB stars and not RGB stars. This 60-day period also happens to correspond with roughly the point when AGB stars transition from second and third overtone pulsation to the first overtone pulsation mode. Additional nodes will also result in lower pulsational amplitude (smaller change in brightness and radius over one period) for the star, leading AGB stars to have bigger amplitudes at this point. RGB stars seem to pulse only in the second and third overtone modes. This is most likely responsible for why they produce so much less dust and experience less mass-loss at the same period as their AGB star counterparts.
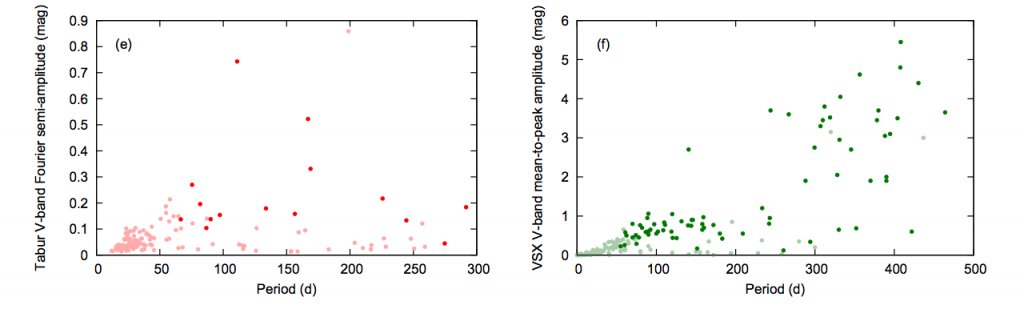
Figure 3: This is part of Figure 2 from the paper, showing amplitude in the V-band plotted against period. In both subplots, the darker colored circles are stars with substantial dust excess, and the lighter colored circles are stars without substantial dust excess. This seems to suggest that greater dust excess corresponds with greater amplitude. Greater amplitude also usually indicates fewer radial nodes. The 60 and 300-day increase in dust productions are also visible in both plots.
The relationship between dust production and infrared excess, which the authors use as a proxy for the amount of dust the star is producing, is shown in Figure 2. From this figure, we can see that at periods longer than 60 days, there appear to be more stars that are producing dust above their criterion for substantial dust excess. Figure 3 show period-amplitude diagrams, where the pulsational amplitude is plotted against the pulsational period (where the amplitude suggests of the mode of pulsation). From this diagram, we can see that the stars with less dust production appear to also have lower amplitudes of pulsation. Together, these support the hypothesis that the pulsational mode plays a critical role in producing dust and driving mass loss. These results also confirm the increase in mass-loss at 300 days, which roughly corresponds with stars transitioning from the first overtone pulsation to the fundamental mode.
Conclusion
So what’s next? Well, as you might expect, the follow up to science is usually…more science! The authors point out that further study will be necessary in order to get conclusive evidence for exactly what role this critical period serves and how pulsational mode can affect it. Is it really a change in the stellar-mass loss rate, or is the stellar wind pre-existing, and the 60-day period just coincides with an increase in dust condensation? Similar studies focusing on stars with different metallicities will also be a good check to see whether these critical periods are universal.
Author
Trackbacks/Pingbacks