Title: A new method to identify subclasses among AGB stars using Gaia and 2MASS photometry
Authors: T. Lebzelter, N. Mowlavi, P. Marigo, G. Pastorelli, M. Trabucchi, P.R. Wood, I. Lecoeur-Taibi
First Author’s Institution: University of Vienna, Department of Astrophysics
Status: Accepted for publication in A&A Letters, open access on arXiv
Figure 1. Hertzsprung-Russell diagram with the asymptotic giant branch highlighted [Source: NOAO].
Asymptotic Giant Branch (AGB) stars are bright but cool (if a few thousand Kelvin can be considered cool). A star with a mass of 8M ☉ or less will usually evolve into an AGB star towards the end of its life. AGB stars are named so because of the region they occupy on the Hertzsprung-Russell diagram (see Figure 1, and this Astrobite for details on how they get to that region in the first place). At this point in its life, a star has burned through all of the helium in its core and appears as a red giant.
AGB stars play a significant role enriching the metal content of their host galaxies, and can serve as reliable distance indicators by being standard candles. So it makes sense that we should try to detect and characterize them as far out as we can, in order to better understand the local universe.
AGB stars readily show up in multiband observations. Large surveys such as the MACHO Project, the OGLE survey, and (as this paper demonstrates) the Gaia mission have proven invaluable in creating large samples of AGB stars for further study. In this paper, the authors explore how subclasses of AGB stars can be identified using Gaia and 2MASS photometry.
Color me classified
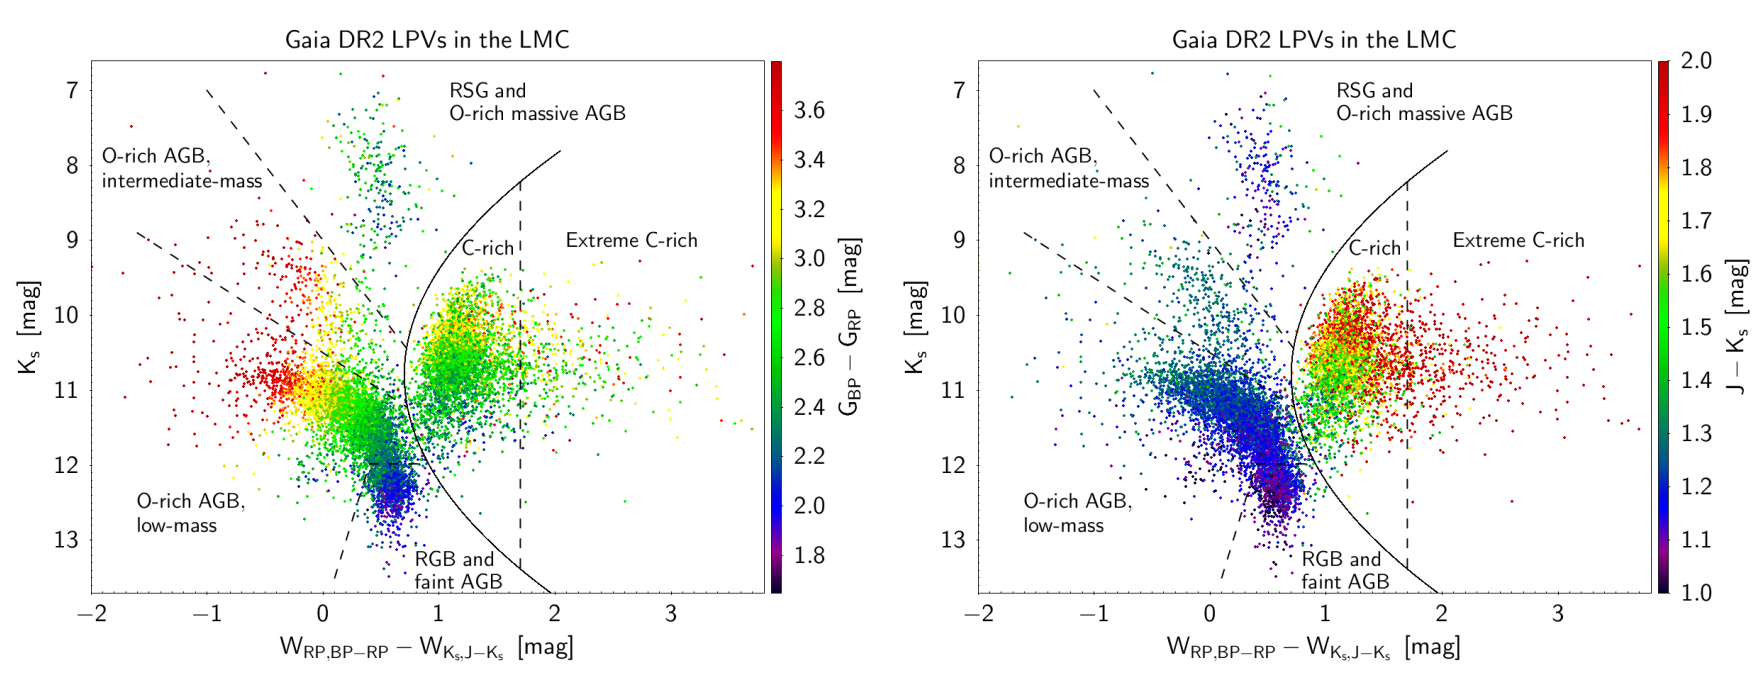
Figure 2. Sorting the LPV stars by Wesenheit function, magnitude, and color. The x-axis unit of both plots is the difference between the Gaia Wesenheit function and the 2MASS Wesenheit function while the y-axis unit of both plots is the KS magnitude. The color bar for the left plot is the Gaia color while the color bar for the right plot is the 2MASS color [Figures 1 and 2 from paper].
In this particular paper, the authors study the previously identified AGB stars in the Large Magellanic Cloud (LMC). They focus specifically on the long period variables (LPVs) that were already known to 2MASS and have been observed by Gaia. AGB stars are usually LPVs and have variability periods on the order of tens to hundreds of days. The stars in the sample are primarily classified based on how oxygen-rich (O-rich) or carbon-rich (C-rich) they are (AGB stars tend to be one or the other, or somewhere between the two). The near-infrared (NIR) 2MASS J and KS bands are useful for this, as are the Gaia GBP and GRP bands. The stars’ magnitudes in the aforementioned bands are used to calculate their colors, which are the differences in magnitude across different bands. The stars’ colors point to their chemical composition and other properties, allowing them to be classified.
Given that the color of stars depends heavily on measured magnitudes, the authors are concerned with the effect of interstellar dust. Interstellar dust can scatter blue light more than red light, causing objects to appear redder than they actually are. Without accounting for this reddening, stars can be misidentified and so, misclassified. To get around the issue of interstellar reddening, the authors utilize something called the Wesenheit function.
The Wesenheit function assumes that the effect of reddening is about the same from star to star. It is calculated using two available magnitudes and a factor R, which accounts for reddening from a particular source, such as circumstellar dust. In this paper, the authors come up with a value for R to account for interstellar dust by utilizing dust maps of the sky. They consider the Gaia magnitudes GBP and GRP with R to define the Wesenheit function WRP, which is used with the pre-existing Wesenheit function WK for the rest of the analysis.
The resulting Wesenheit functions are used in conjunction with the Gaia and 2MASS colors as well as the KS magnitudes to sort the LPVs (see Figure 2). When plotting with the 2MASS colors, the O-rich and C-rich stars distinguish themselves quite nicely. This has to do with absorption features in the stars’ spectra.
Initial differences
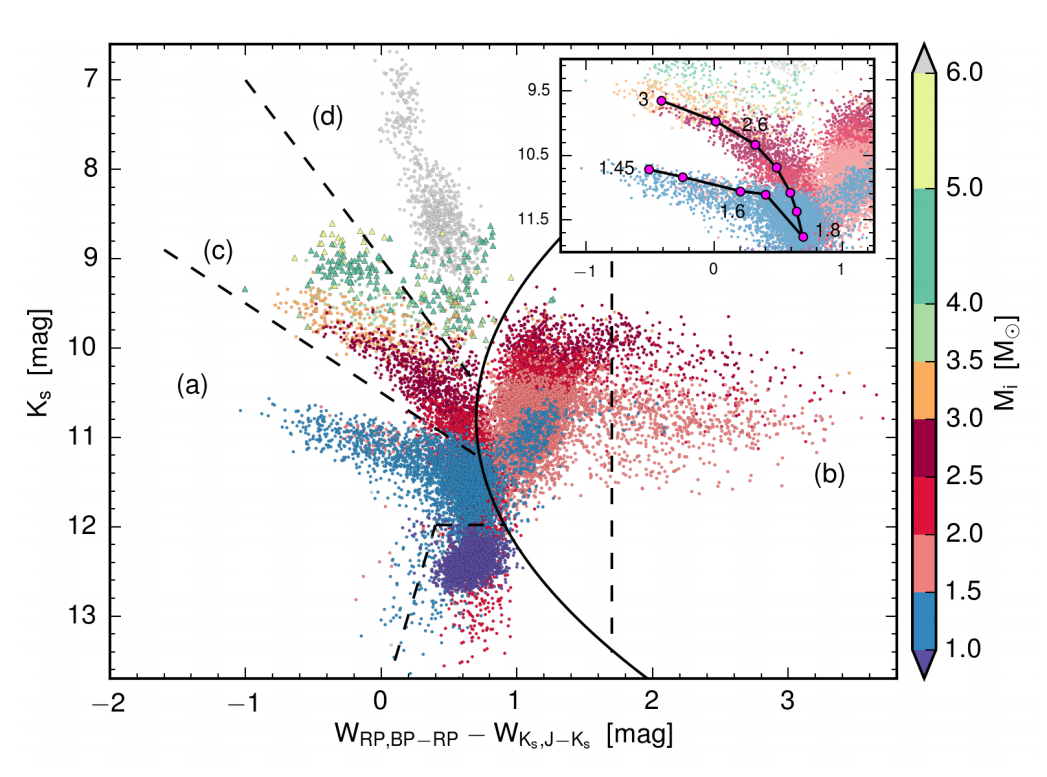
Figure 3. The simulated population of the LMC with the same x- and y-axis of the previous plots but with the color bar being the initial stellar mass. The inset plot indicates the window for the formation of C-rich stars with the curve connecting the stages just before a star with that starting mass would evolve into a C-rich star [Figure 3 from paper].
O-rich stars and C-rich stars also ought to have different initial masses when they form. C-rich stars in particular tend to live in a window of 1.45 to 3 or 3.5 M ☉. This difference in starting masses has an impact on how the stars burn through their lives. To check their classification system, the authors use a simulation of the stars in the LMC (see Figure 3). They find that the stars fall into their predicted groups with significant distinction, demonstrating that the method could be applied successfully to other datasets (see Figure 4)!
Armed with this new method, the authors intend to tackle more Gaia data and different stellar populations. Given the usefulness of AGB stars, this work should be able to interlock very nicely with various subfields in astronomy.

Figure 4. The simulated population of the LMC again with the same x- and y-axis of the previous plots but with the color bar being the ratio between the star’s carbon and oxygen content. The redder (for purposes of this plot) C-rich stars stand out on the right from the bluer O-rich stars on the left [Figure 5 from paper].
Featured image is a view of the LMC from the Spitzer Space Telescope [NASA/JPL-Caltech/STScI]
Author
Trackbacks/Pingbacks